Index
Prequisites
To use this indicator you should have available the following prequisites
- NinjaTrader 8. Click here to download
- Order Flow data is not required to use this indicator (you don't need to have Ninjatrader Lifetime license)
- automated-trading.ch Account with Premium Subscription
Description
The Anchored VWAP[Advanced] is a premium NinjaTrader 8 indicator which has the following features
- Display of VWAP in 2 modes
- Session Mode: Display VWAPs defined on a time interval for each trading session
- Click & Drag Mode: This mode allows to interactively creates VWAPs on the chart using mouse clicks
- Works Seamlessly with or without OrderFlow Data or Tick replay
- Works Seamlessly on any timeframe including Renko Bars
- Export of VWAP levels as Plots that can be used from the Ninjatrader Strategy Builder, AlgoStudio or Bloodhound 3rd-party Software
We highly recommend joining our discord community by following this invite link
![]()
Examples
Here are few examples of the indicator in action:
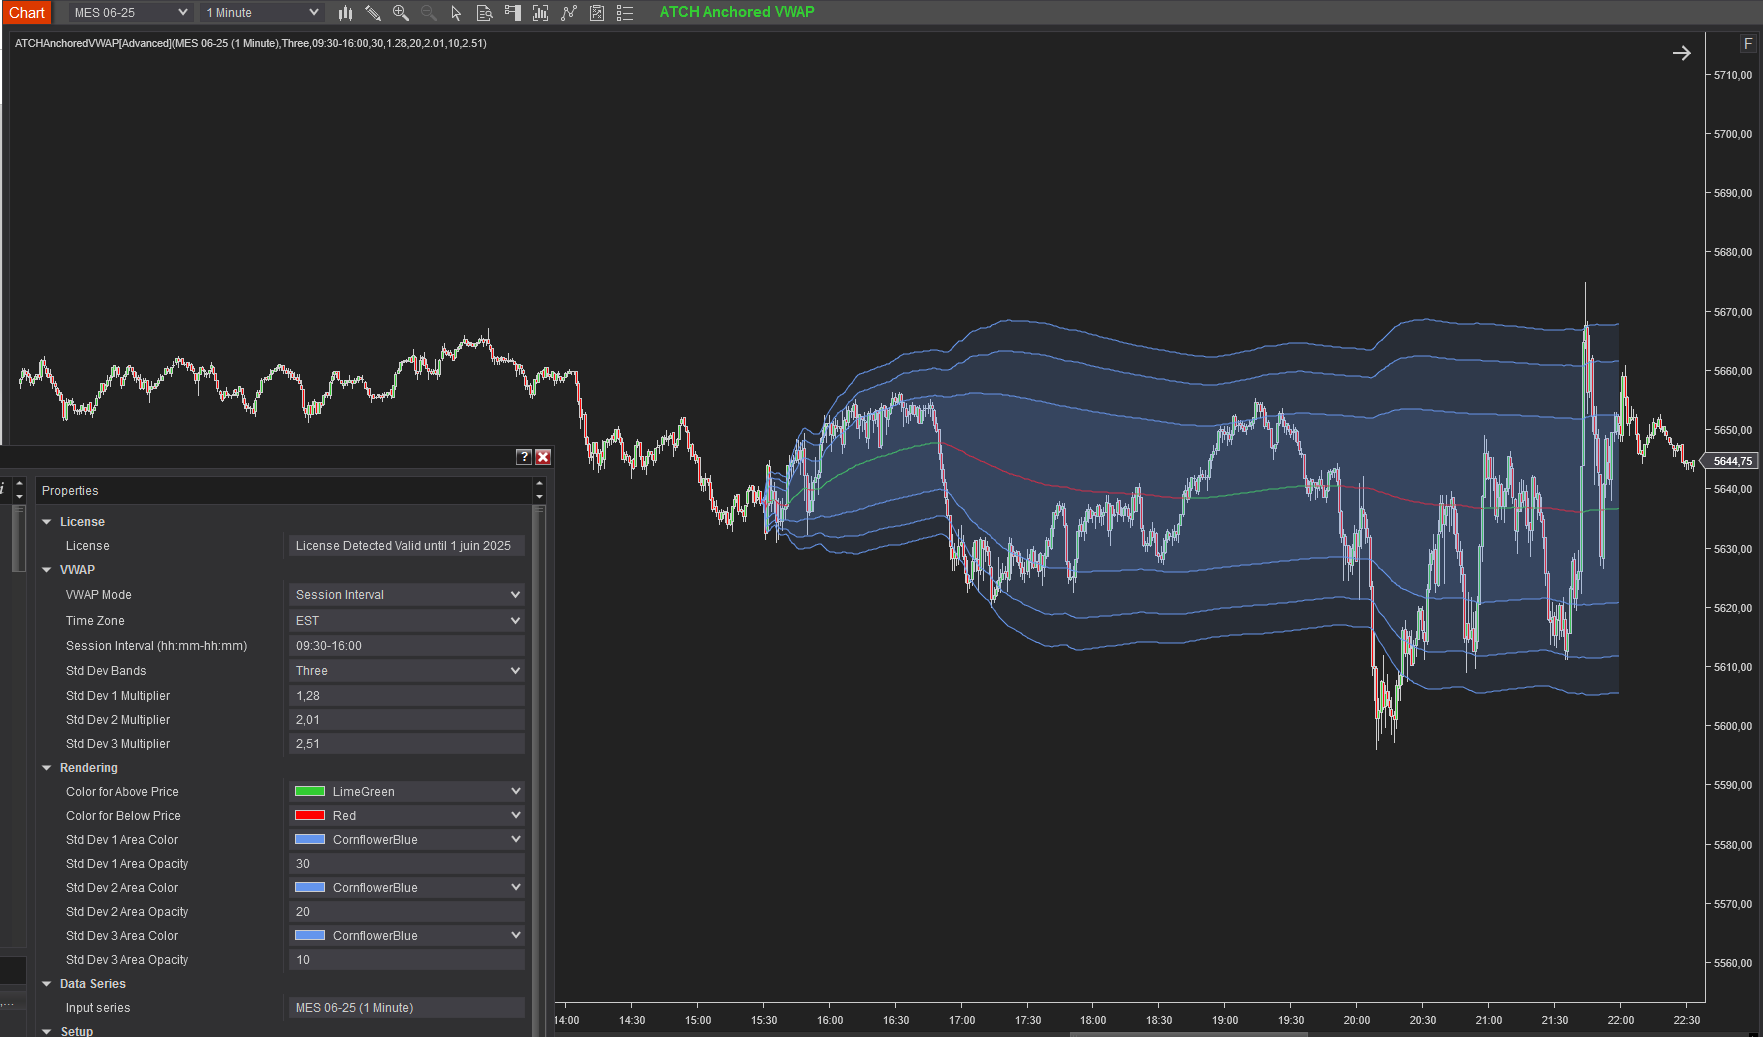
The most straightforward usage of the indicator is to draw the VWAP on the RTH (Regular Trading Hours) session times of a US Future instrument
Off course you can change the session time interval to whatever session suits the instrument. The time interval works seemlesly on time-based Timeframes and on price-based timeframes such as Renko bars or Range Bars. If you want to draw the VWAP indicator on two or more seperate intervals for the same trading session, you can add as many instances of the indicator to the chart, each with its own session interval
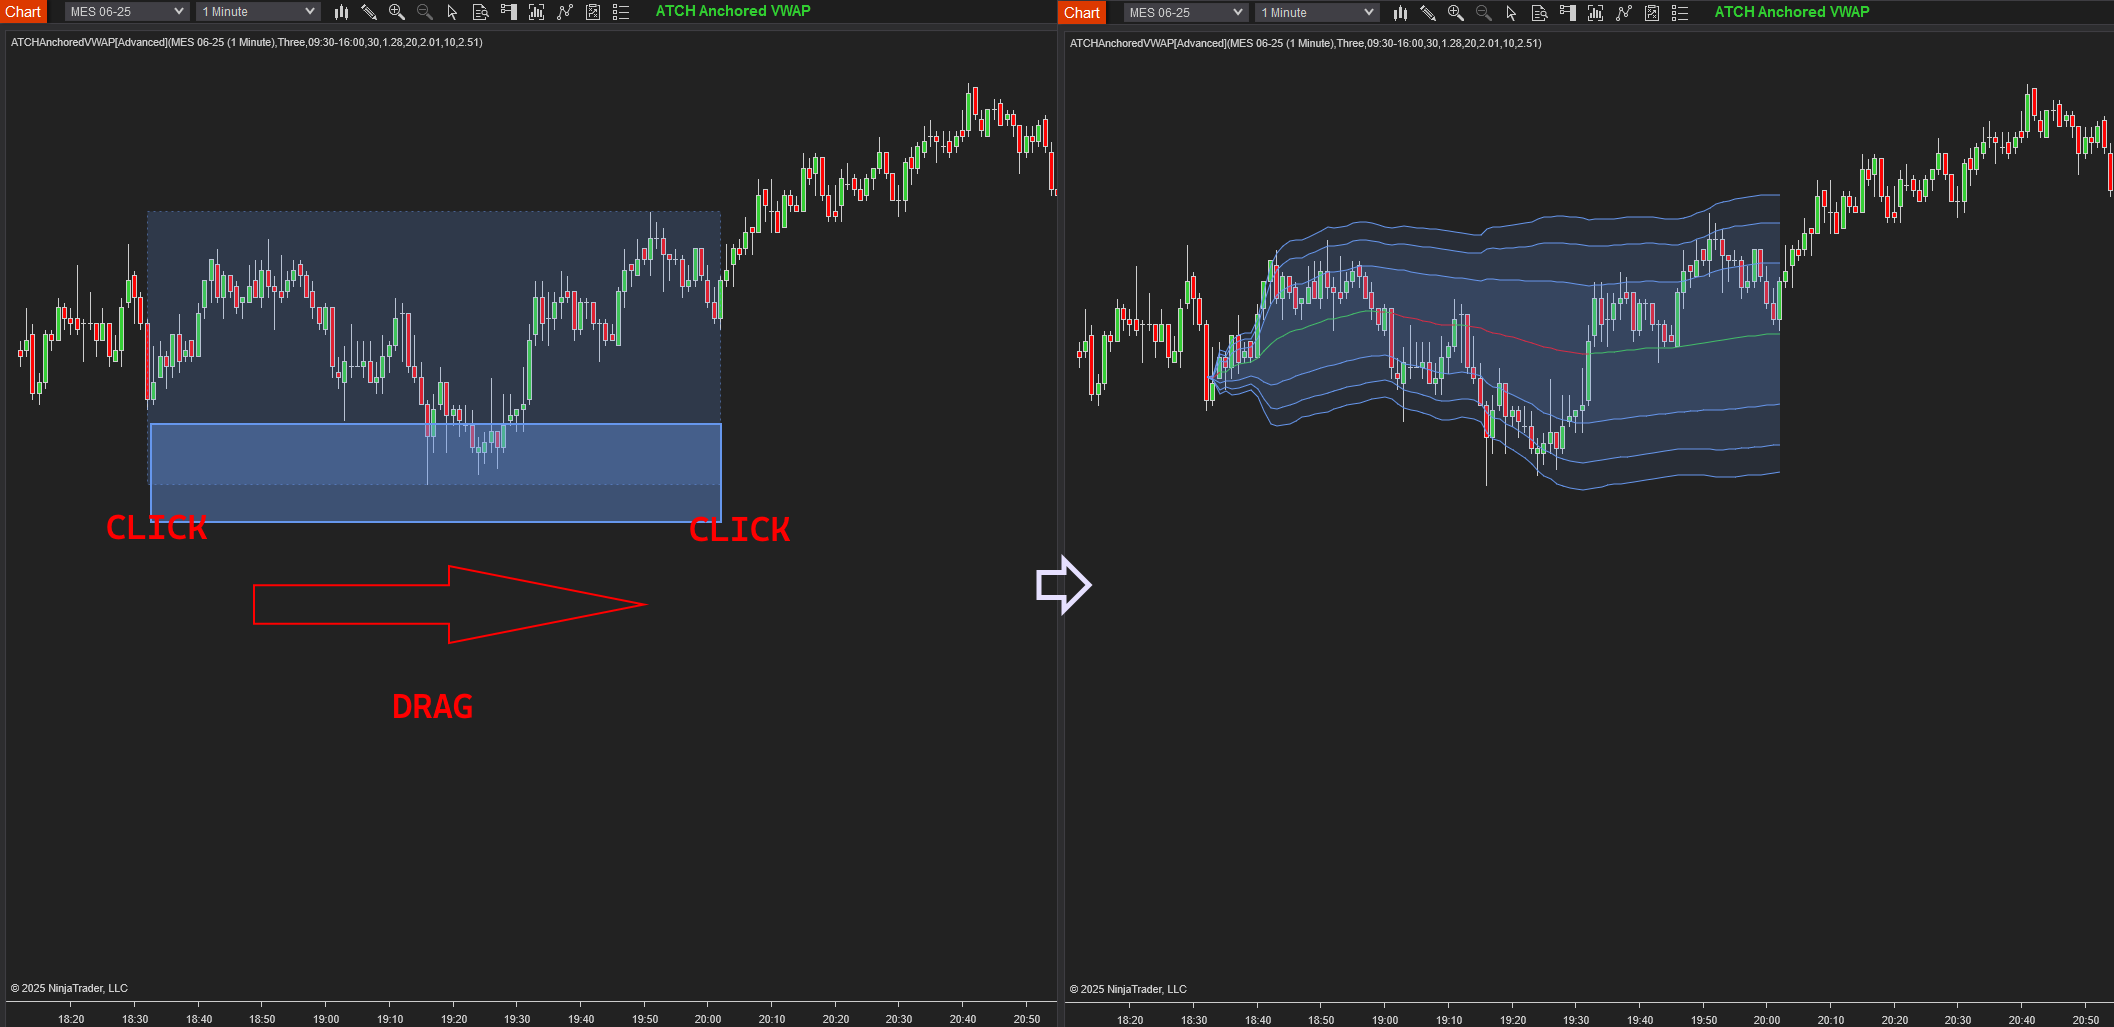
The Anchored VWAP indicator can be operated under the Click & Drag mode, which allows to add VWAPs on the chart with mouse clicks. On the below example you can see how to create a VWAP. First you click on a start index, then drag the mouse into the target inde, then click a second time to trasform the selection into a VWAP
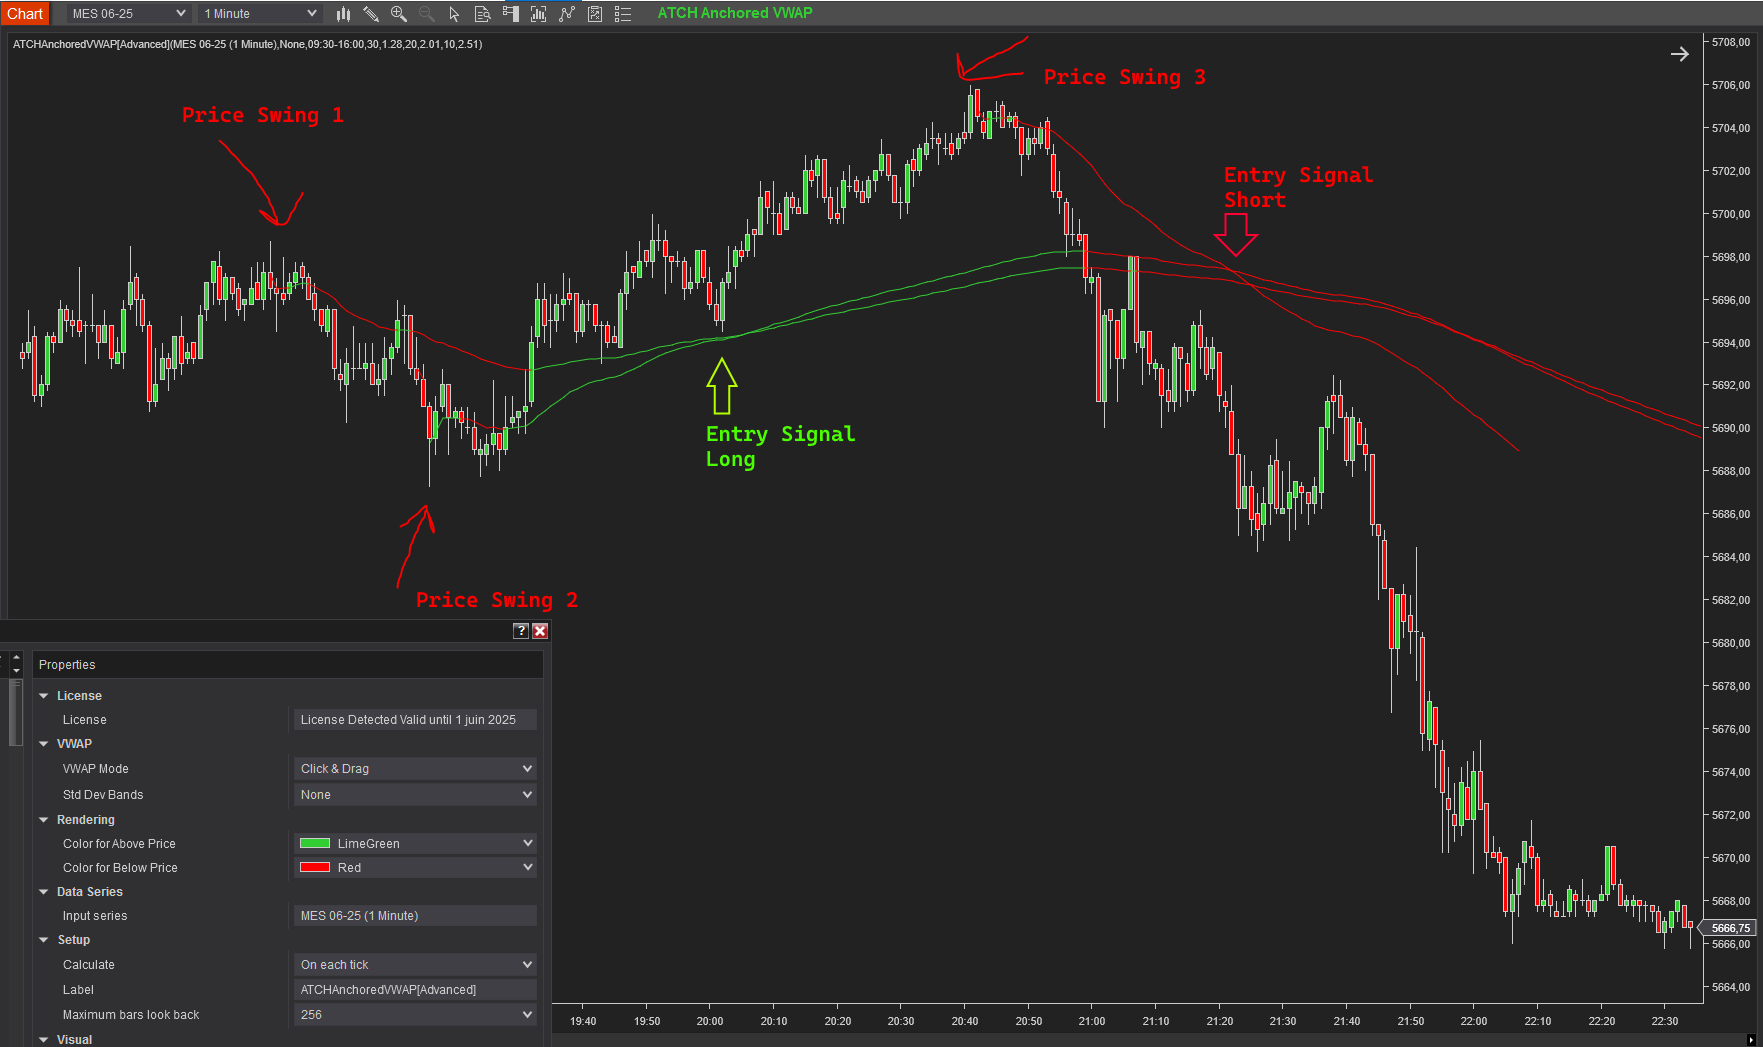
One of the usage cases of the indicator is to draw VWAPs from anchor price points such as price swings. The VWAP in this case, can be used as an alternative to moving averages, and signals can be generated where inverse VWAPs intersect
Parameters
We always try to keep the parameters to minimum.
| License | |
| License | This is the license key you get when you create an account on automated-trading.ch. After creating an account, copy your license key from the billing page. You need to set this parameter only once per month, once the license key is validated it will be remembered for the rest of the month. |
| VWAP | |
| VWAP Mode | This parameter allows you to switch between two modes:
|
| Time Zone |
This parameter sets the time zone to be used for setting the Session Interval parameter below. Since futures markets are open and closed based on US market time zone which is EST (US Eastern, New York), this parameter allows you to specifiy trade time interval on another timezone which is your local machine timezone or European central
|
| Session Interval (hh:mm-hh:mm) | This parameter sets the time interval that defines the trading session.
For example if you want to draw VWAP on the RTH session, the value of this parameter should be "09:30-16:15" while setting the timezone to EST |
| Std Dev Bands | Selects the number of standard deviation bands to display. From None to 3 |
| Std Dev 1 Multiplier | Sets the multiplier for the first standard deviation band. |
| Std Dev 2 Multiplier | Sets the multiplier for the second standard deviation band. |
| Std Dev 3 Multiplier | Sets the multiplier for the third standard deviation band. |
| DataSeries Source |
This parameter sets the source for VWAP calculation. you can chose among the following options
|
| Rendering | |
| Color for Above Price | Defines the color of the VWAP line when it is above the price. |
| Color for Below Price | Defines the color of the VWAP line when it is below the price. |
| Std Dev 1 Area Color | Sets the fill color around the first standard deviation line area |
| Std Dev 1 Area Opacity | Determines the opacity of the first standard deviation line area |
| Std Dev 2 Area Color | Sets the fill color around the second standard deviation line area |
| Std Dev 2 Area Opacity | Determines the opacity of the second standard deviation line area |
| Std Dev 3 Area Color | Sets the fill color around the third standard deviation line area |
| Std Dev 3 Area Opacity | Determines the opacity of the third standard deviation line area |
Interactive Commands On the Click & Drag Mode
| Extend To Last Bar | |
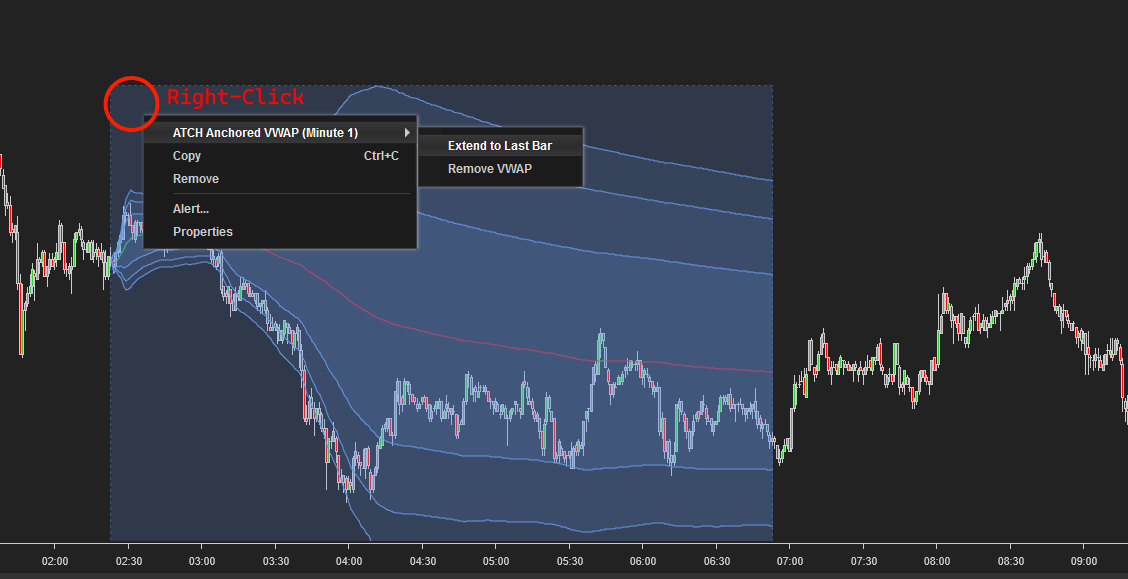
|
The Extend to Last Bar command will extend the clicked VWAP until the most recent bar on the chart. Hence, the vwap will be active and it will be extended to new bars created and it will be recalculated at each new bar |
| Stop Extending & Remove VWAP | |
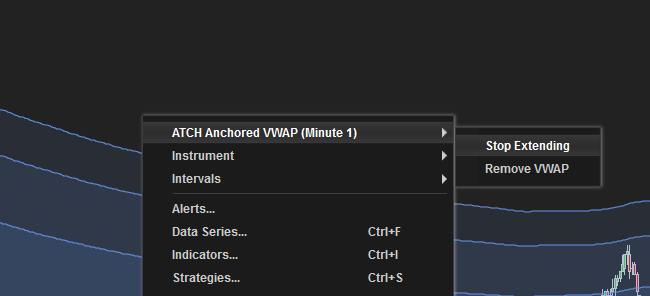
|
The Stop Extending command will mark the clicked VWAP as inactive and it will stop extending it to new bars The Remove VWAP command will remove the profile from the chart. This is required as the "Delete" Keyboard button cannot be used to remove the profile, so this menu entry was created for this purpose. |
| Toggle Enable/Disable Anchored VWAP | |
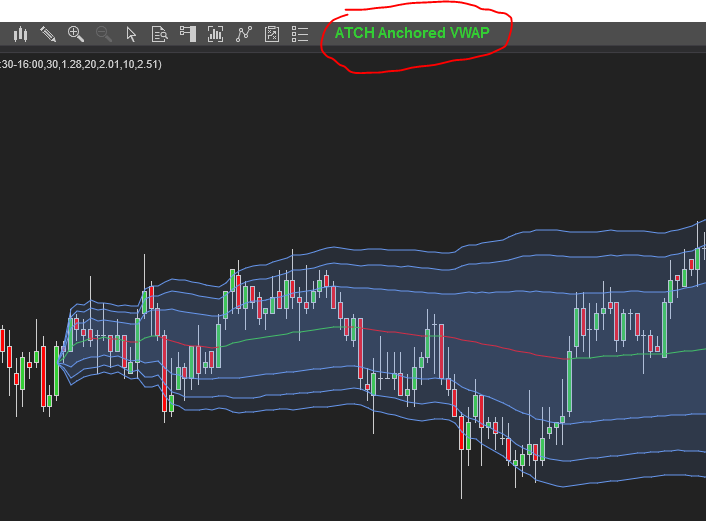
|
Manipulating VWAPs on the chart can interfere with trading. Or can lead to unwanted effects on the chart like creating a click'n'drag vwap where the user wanted to just scroll the chart or close a trade. For this, the indicator expose a toolbar button that allow to enable toggling on/off the VWAP mouse interactions. When this button is lighting Green, it means it is active and when it is Grey it means it is deactivated |
| Change DataSource of Anchored Vwaps | |
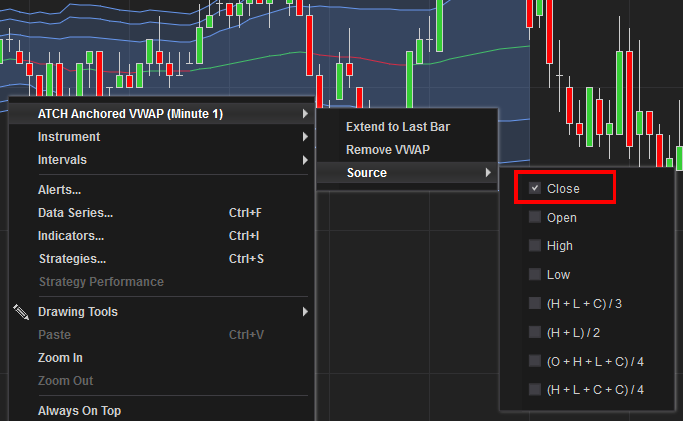
|
On both Click & Drag and Click & Extend vwaps, DataSource can be changed by right-clicking on the vwap and then selecting another DataSource from the available data sources as illustrated on the image below. Once a selection is made, the vwap will be updated instantaneously. |
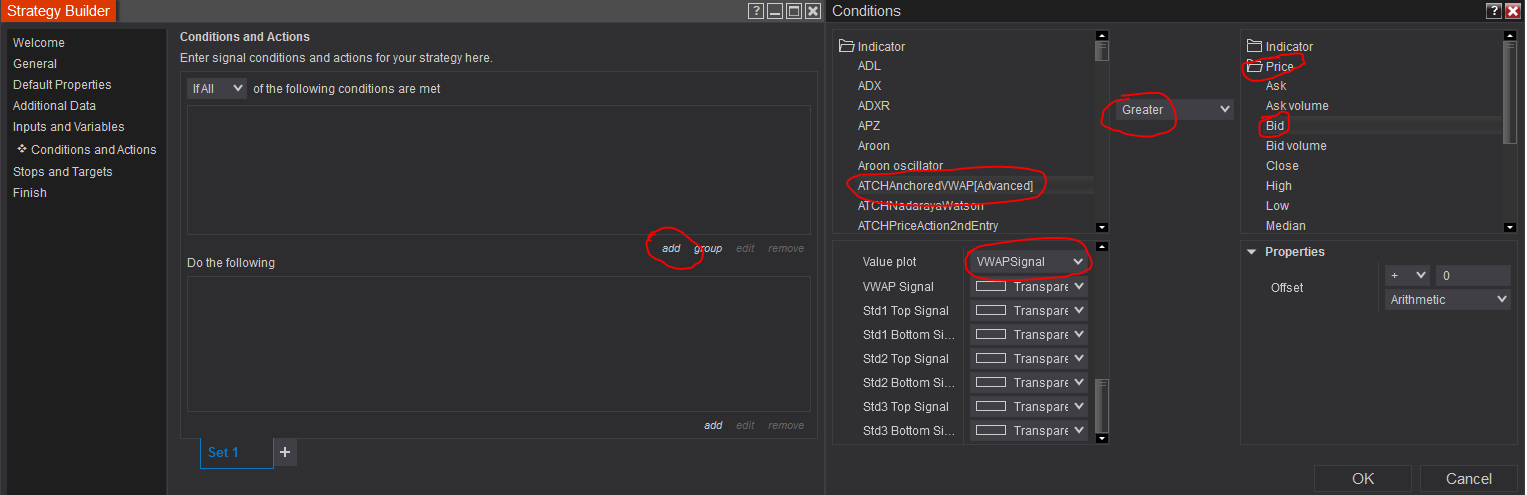
Signals & Usage in Strategy Builder
The indicator exposes signals that can be used from the Strategy Builder and Third-party software such as Bloodhound and AlgoStudio.
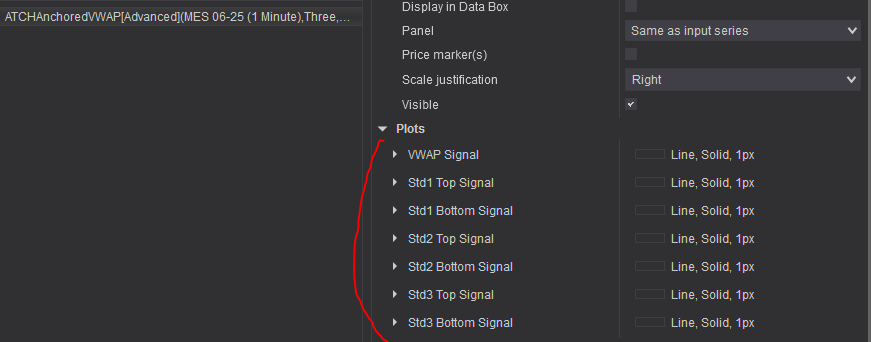
Those signal plots are transparent and are not drawn on the chart. To use them from the strategy builder you can select them and build a logic upon their values like this:
Download & Installation Instructions
To download and install the indicator follow the instructions below
- Click on the below download button to download the Indicator file
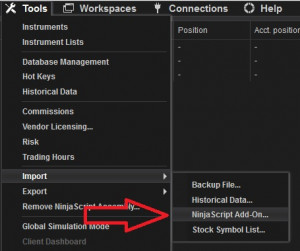
- Import the downloaded .zip file into NinjaTrader using the import NinjaScript menu item
- Next, open a new chart window
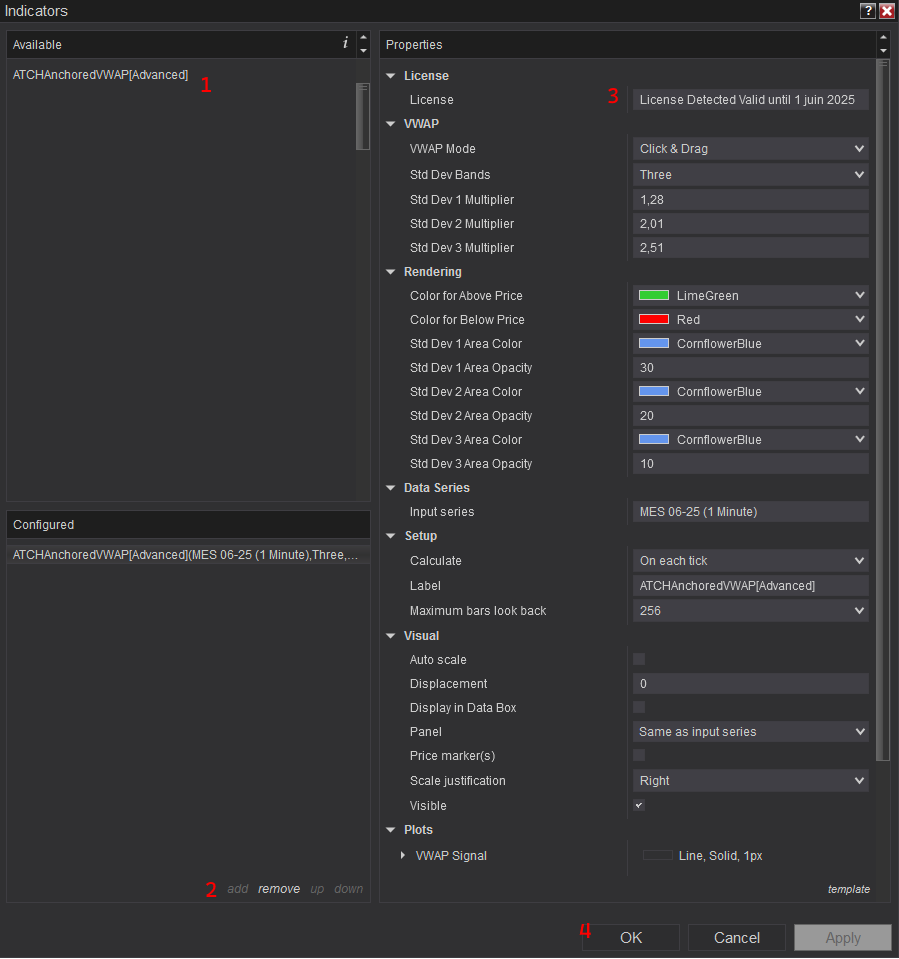
- After installing the indicator and opening a new Chart window you should add the indicator to the chart. Right-click on the chart and click on Indicators...
- Copy/Paste your license key that you can find on the Billing page into the license parameter
- The indicator requires the Premium Subscription. Check the Pricing page for details
- After adding the indicator to the chart with a valid license, the indicator will be run on Historical data loaded on the chart.
- After that, the indicator is added with success and will continue to run on live market data

Frequantly Asked Questions
General
Yes, If you have an idea that you believe can improve this indicator, I will be more then happy to hear from you. Please use the contact page to send me a message
No, the source code of the indicator is protected for copyright reasons
Yes, this indicator Exposes the VWAP values through Plot series that can be used from within a strategy
Yes you can use this indicator without TickReplay and without Orderflow
Release Notes
- Drawing of vwap is pushed behind chart candlestick for better clarity
- Added DataSource parameter (Open, close, High, Low, (H+L) / 2 , ...)
- Added new VWAP mode : Click & Auto Extend
- Fix Bug : Import issue class conflict with Open Range Breakout strategy
- Fix Bug : indicator hides Grid lines when added to chart
- Fix Bug : Std Dev bands don't take the input parameters
- Fix Bug : Std bottom Signals not having values
- Fix Bug : Saving template file generates an error
- Fix Bug related to Timezone
- Fix Importing Error
- First Release of the indicator
User Comments & Feedback
You can find feedback of our users and ask questions about this strategy by joining our discord community by following this invite link or clicking on the Discord logo image. Joining is completely free
![]()