Index
Prequisites
To use this indicator you should have available the following prequisites
- NinjaTrader 8. Click here to download
- Order Flow data is not required to use this indicator (you don't need to have a Lifetime license)
- automated-trading.ch Account with Premium Subscription
Getting Started Video
Description
The Volume Profile indicator [Advanced] is a premium NinjaTrader 8 indicator which has the following features
- Display of volume profile in 3 Modes
- Session Mode: Display volume profile defined on a time interval for each trading session
- Bars Mode: Display volume profile on each Bar or an aggregate of bars. This mode also allows auto merging of profiles
- Click & Drag Mode: This mode allows to interactively creates volume profiles on the chart using mouse clicks
- Calcuation and display of value area on each volume profile
- Merge and grouping (composition) of volume profile interactively with a mouse click
- Split of volume profile clusters interactively with a mouse click
- Unique Auto Composition of volume profiles based on value area overlapping
- Works Seamlessly with or without OrderFlow Data (No Order Flow data requires Tick replay)
- Works Seamlessly on any timeframe including Renko Bars
- The usage of Machine Learning Algorithm to classify profile types (P-Shape, D-Shape, b-Shape)
- Display of POC and Value Areas as a progressing line through the volume profile
- Show Value Area Gaps which are the volume version of Fair Value Gaps
We highly recommend joining our discord community by following this invite link
![]()
Examples
Here are few examples of the indicator in action:
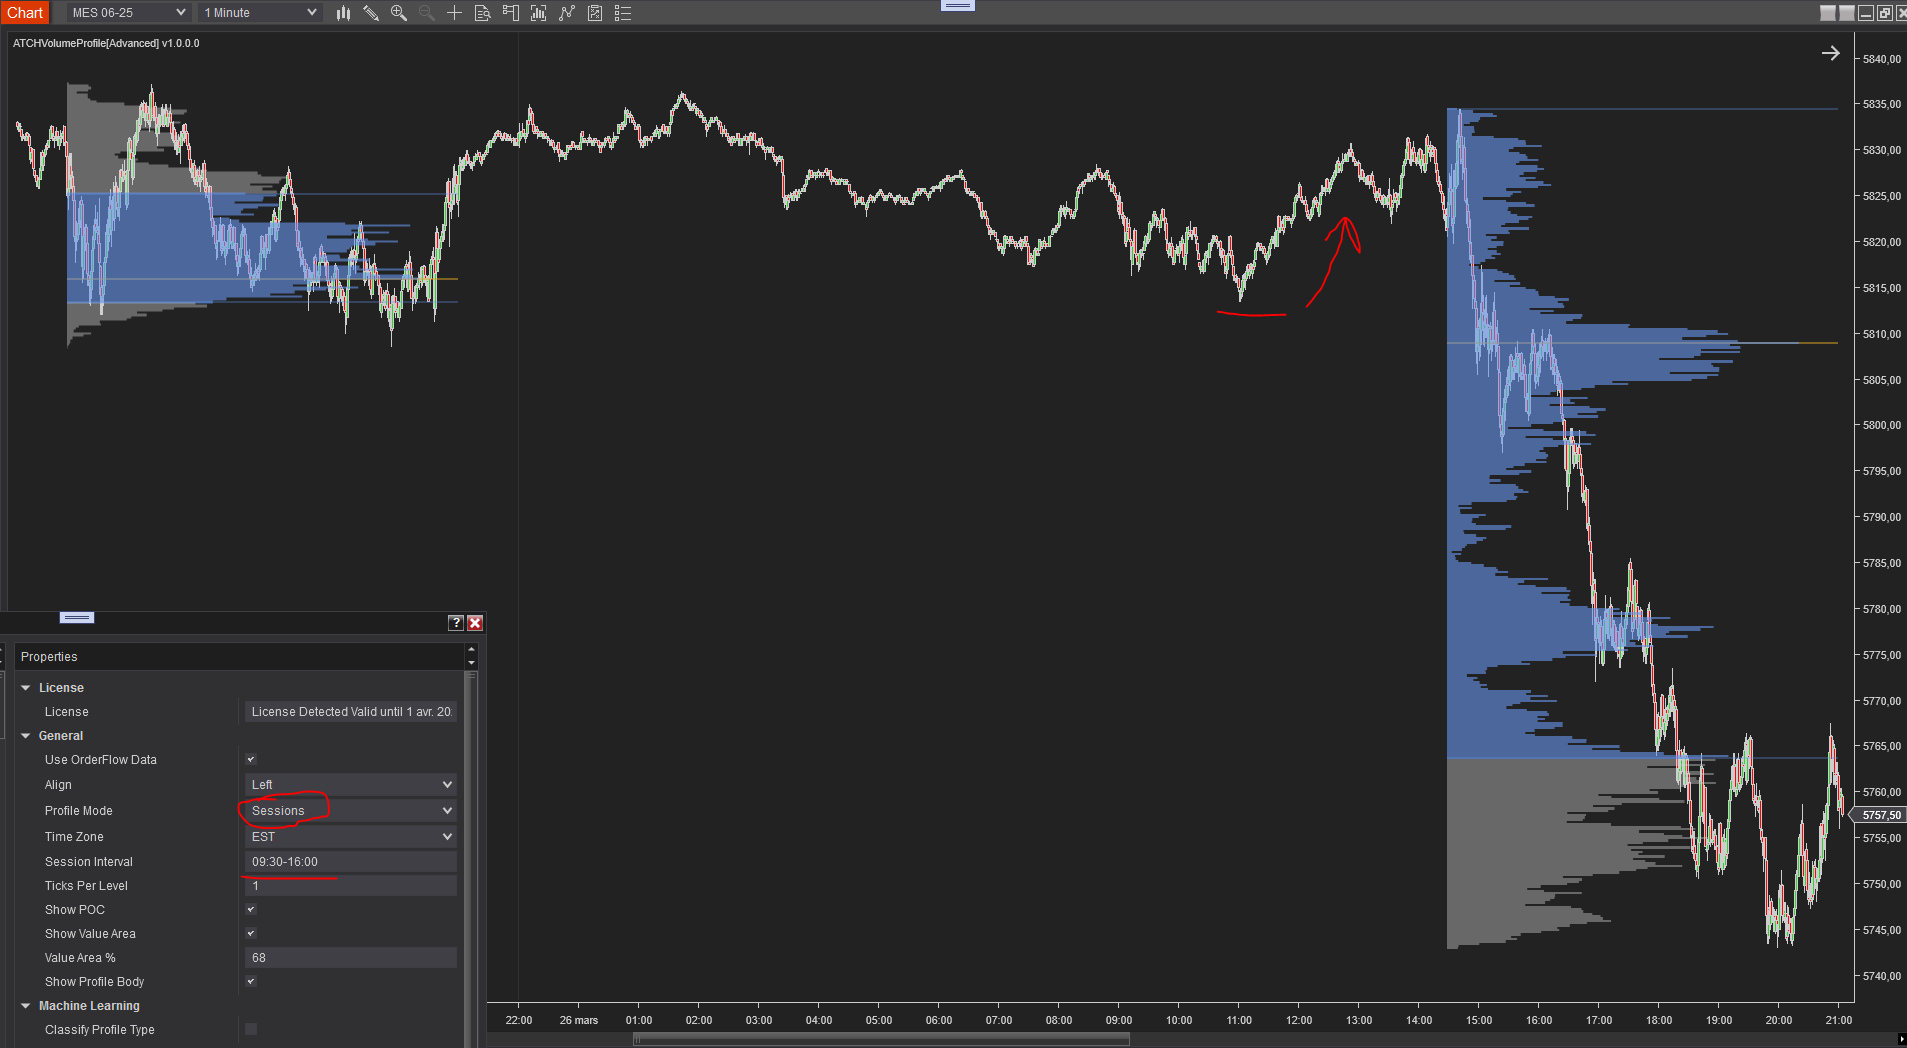
The most straightforward usage of the indicator is to layout RTH session volume profiles and trading price action on POC and Value Area levels on the previous day Volume profile.
Off course you can change the session time interval to whatever session suits the instrument. The time interval works seemlesly on time-based Timeframes and on price-based timeframes such as Renko bars or Range Bars. If you want to activate the volume profile on two seperate intervals for the same trading session, you can add two instances of the indicator to the chart, each with a session interval
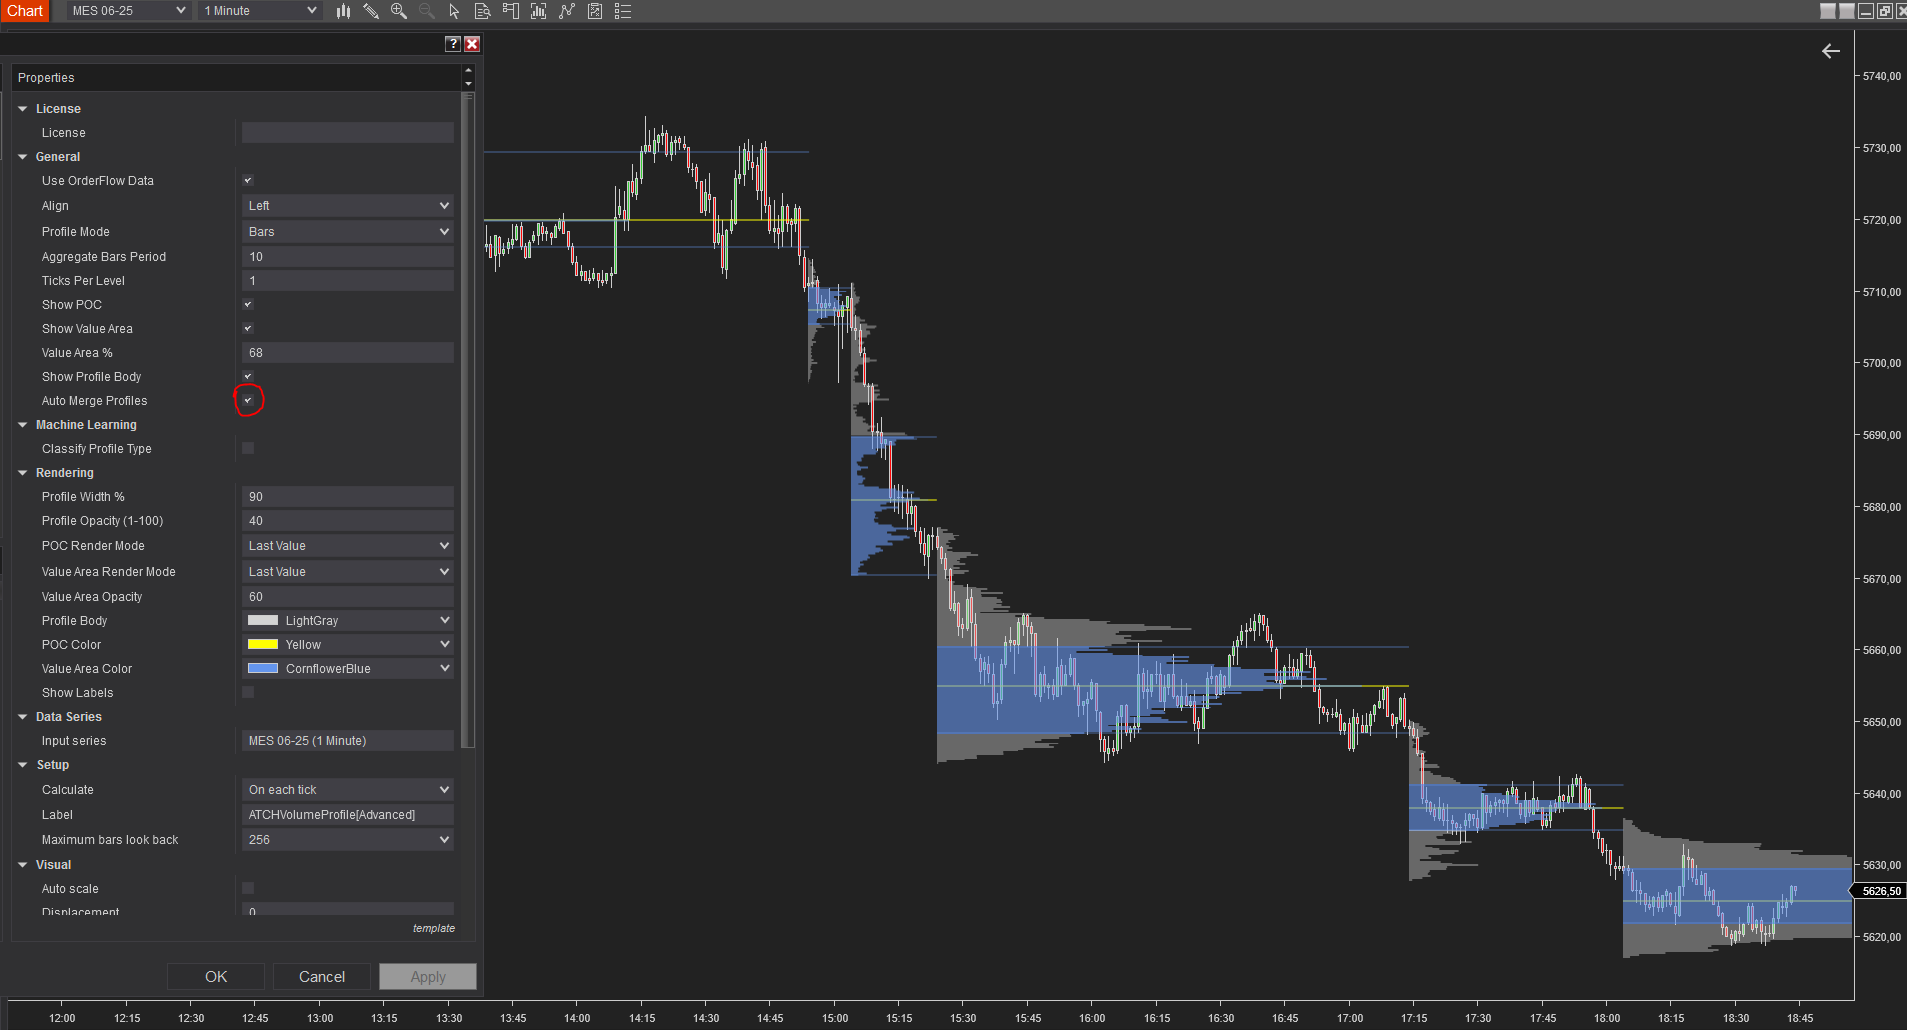
The other basic usage of the indicator is to display volume profiles on each bars on the chart. The volume profiles will show value areas calculated on a parametrizable percentage. The confluence between the value area bounds, the open and close prices and the point of control of the bar can show opportunities for short term scalping. This mode will modify the volume profile sequence according to a merging algorithm based on Value Area overlap. You can Also manually decide to unmerge profiles, or merge them by Right-Clicking on the Volume Profile and click on Context Menu commands
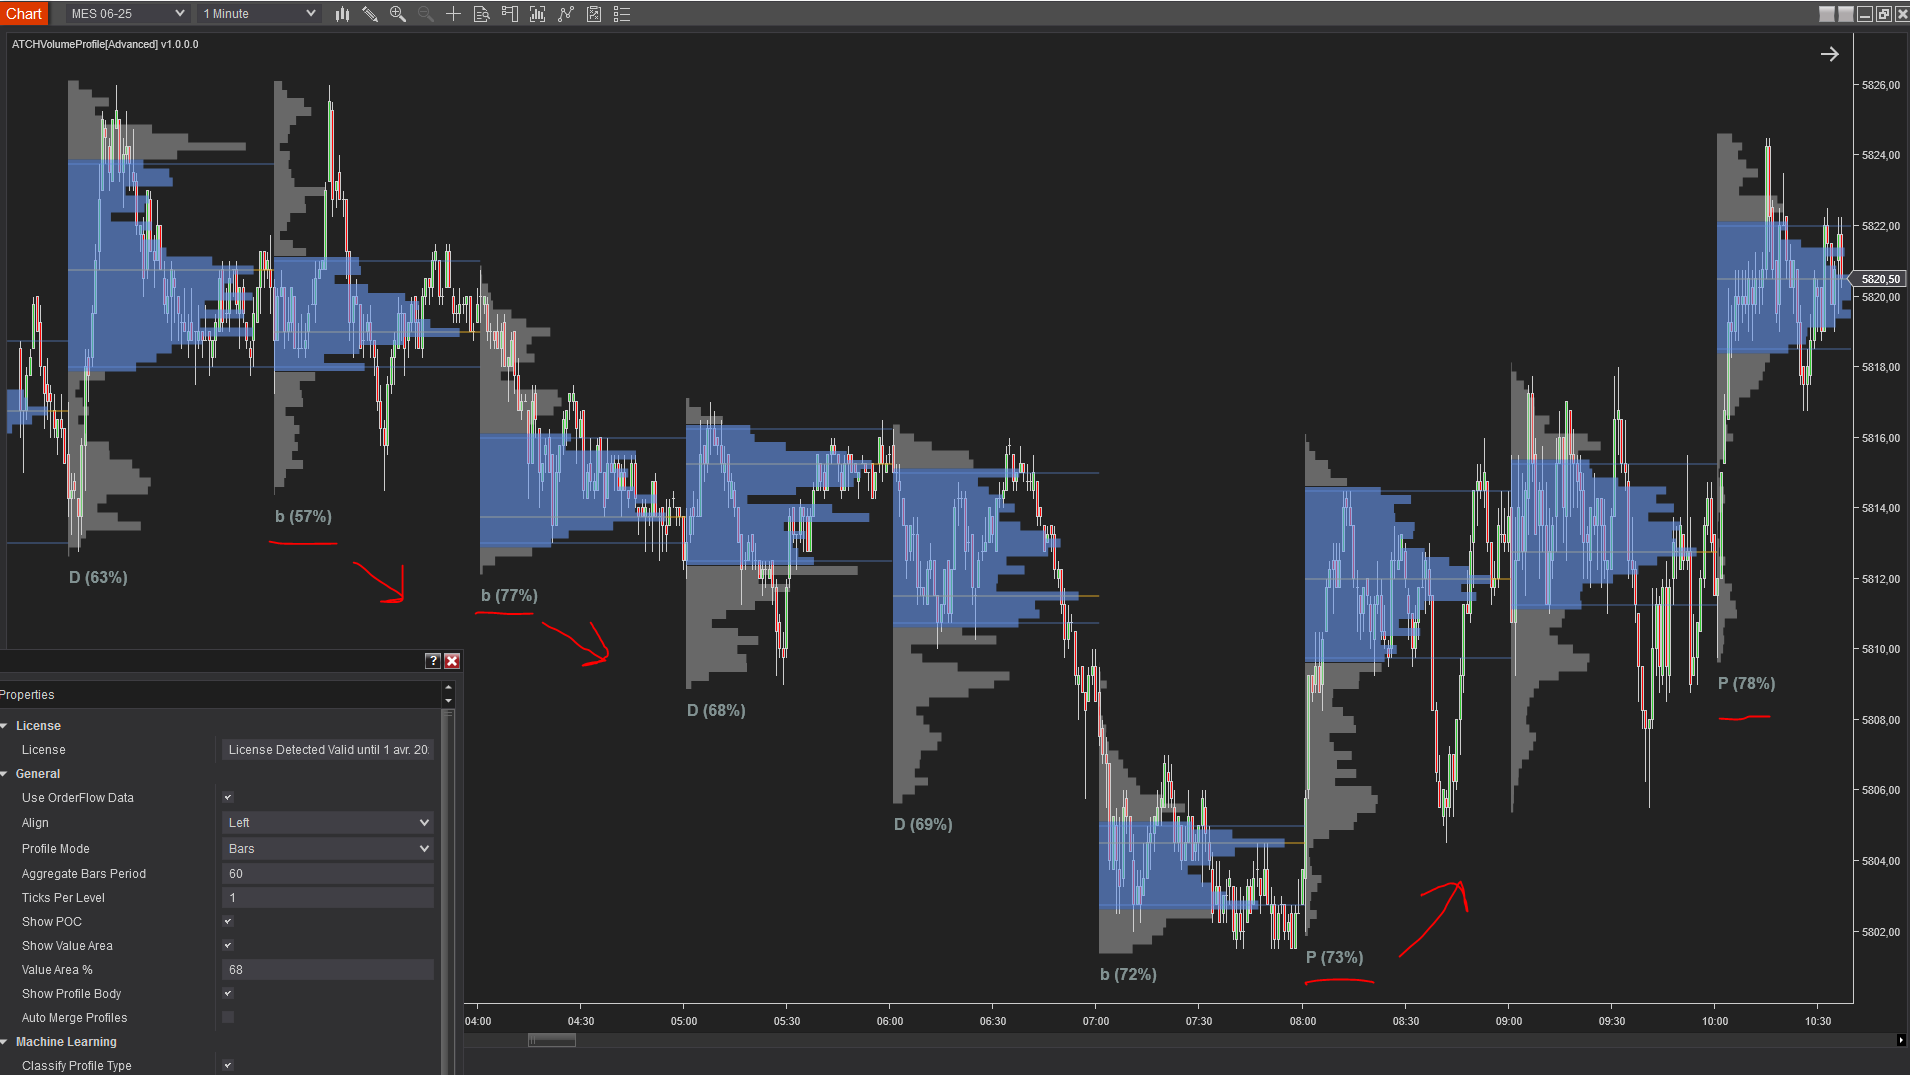
The Volume profile can have three main types:
- P shape : This type suggests that the most volume occured on the top of the profile. When confirmed by the price action this can give a hint that the price may continue going higher
- D shape : This type suggests that the most volume occured on the middle part of the profile. No directional bias can be confirmed
- b shape : This type suggests that the most volume occured on the bottom of the profile. When confirmed by the price action this can give a hint that the price may continue going lower
This example shows how one can use the profile type to confirm a directional bias. The example shows the first "b" cluster followed by the price breaking down followed by a second "b" cluster with a higher confirming score. The example alsow shows a "P" profile that marked price reversal. If you look closely to the first "P" profile price action, you can see that the price was rejected at the lower part of the profile before going up again and closing the Cluster above the POC. This is a strong signal to go bullish
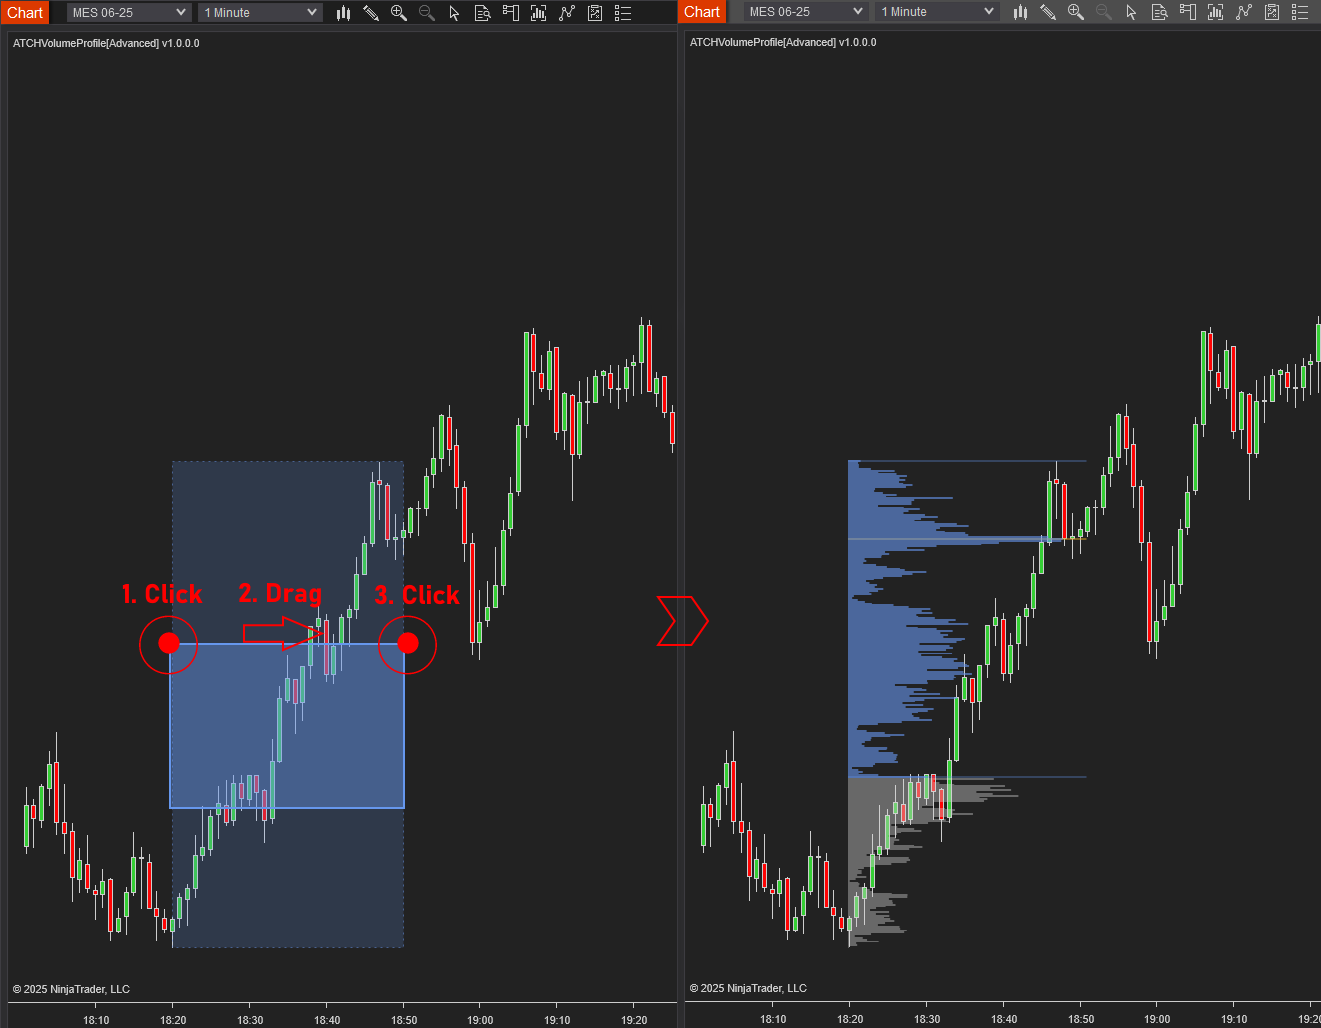
This example illustrates usage of the indicator under the Click & Drag mode where you can create volume profiles by clicking on the chart. To do this click (press and release the mouse) once on the start anchor on the chart, you will notice that a rectangle will be drawn on the chart following the mouse movement, then click a second time on the chart where you want the volume profile to end.
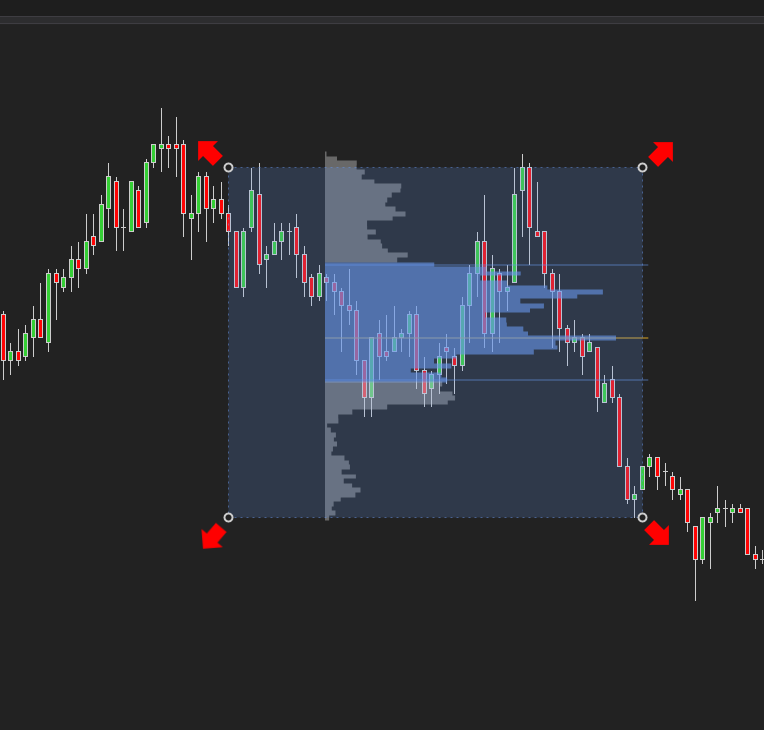
After creating the Volume profile by click & drag actions, you can Transform the volume profile by clicking on it to activate the transfrom state, you can drag it around and you also can remove it by Right-Clicking on it and click on the "Remove Profile" context menu button. You can also Extend the selected volume profile into the latest bar and make it active and extend its calculations with new live price bars
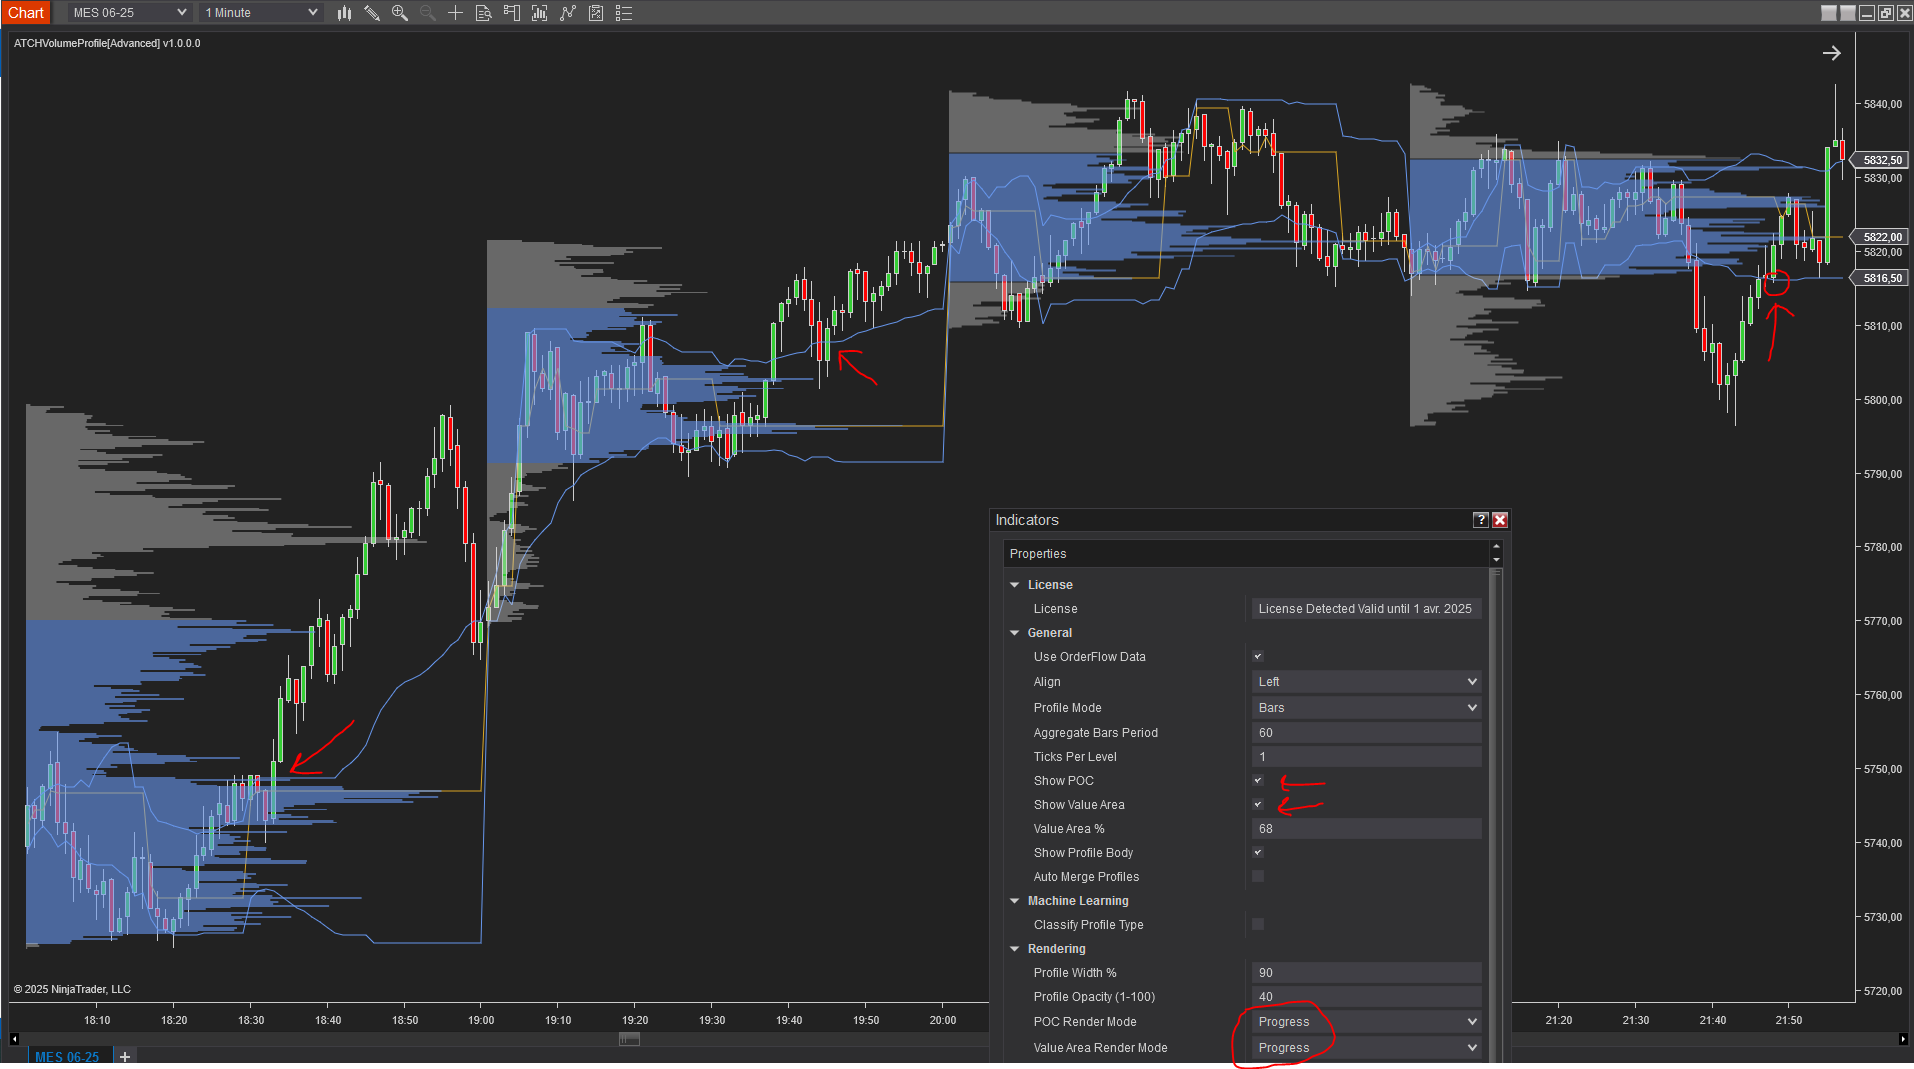
In this example the POC render mode and the Value Area render mode were set to "Porgress" instead of "Last Value". In this mode, the POC & Value Area Lines are drawn in a progressive for each bar. This allow to Visualize how volume has changed inside the volume profile bars cluster which can create trading opportunities when price action visits those levels. For example on the image above on the first leftmost arrow, we can see a clear breakout from the Value Area upper level. The same is observed for the second arrow. Whereas the third arrow shows a case where the price pulled back and broke the Value Area lower level, this can be a trade long to target the POC level.
Value Area Gaps are created when the price leaves a value area up or down without mitigating it, marking a zone that can act as a support resistance zone when price comes back into it. Lets see some examples
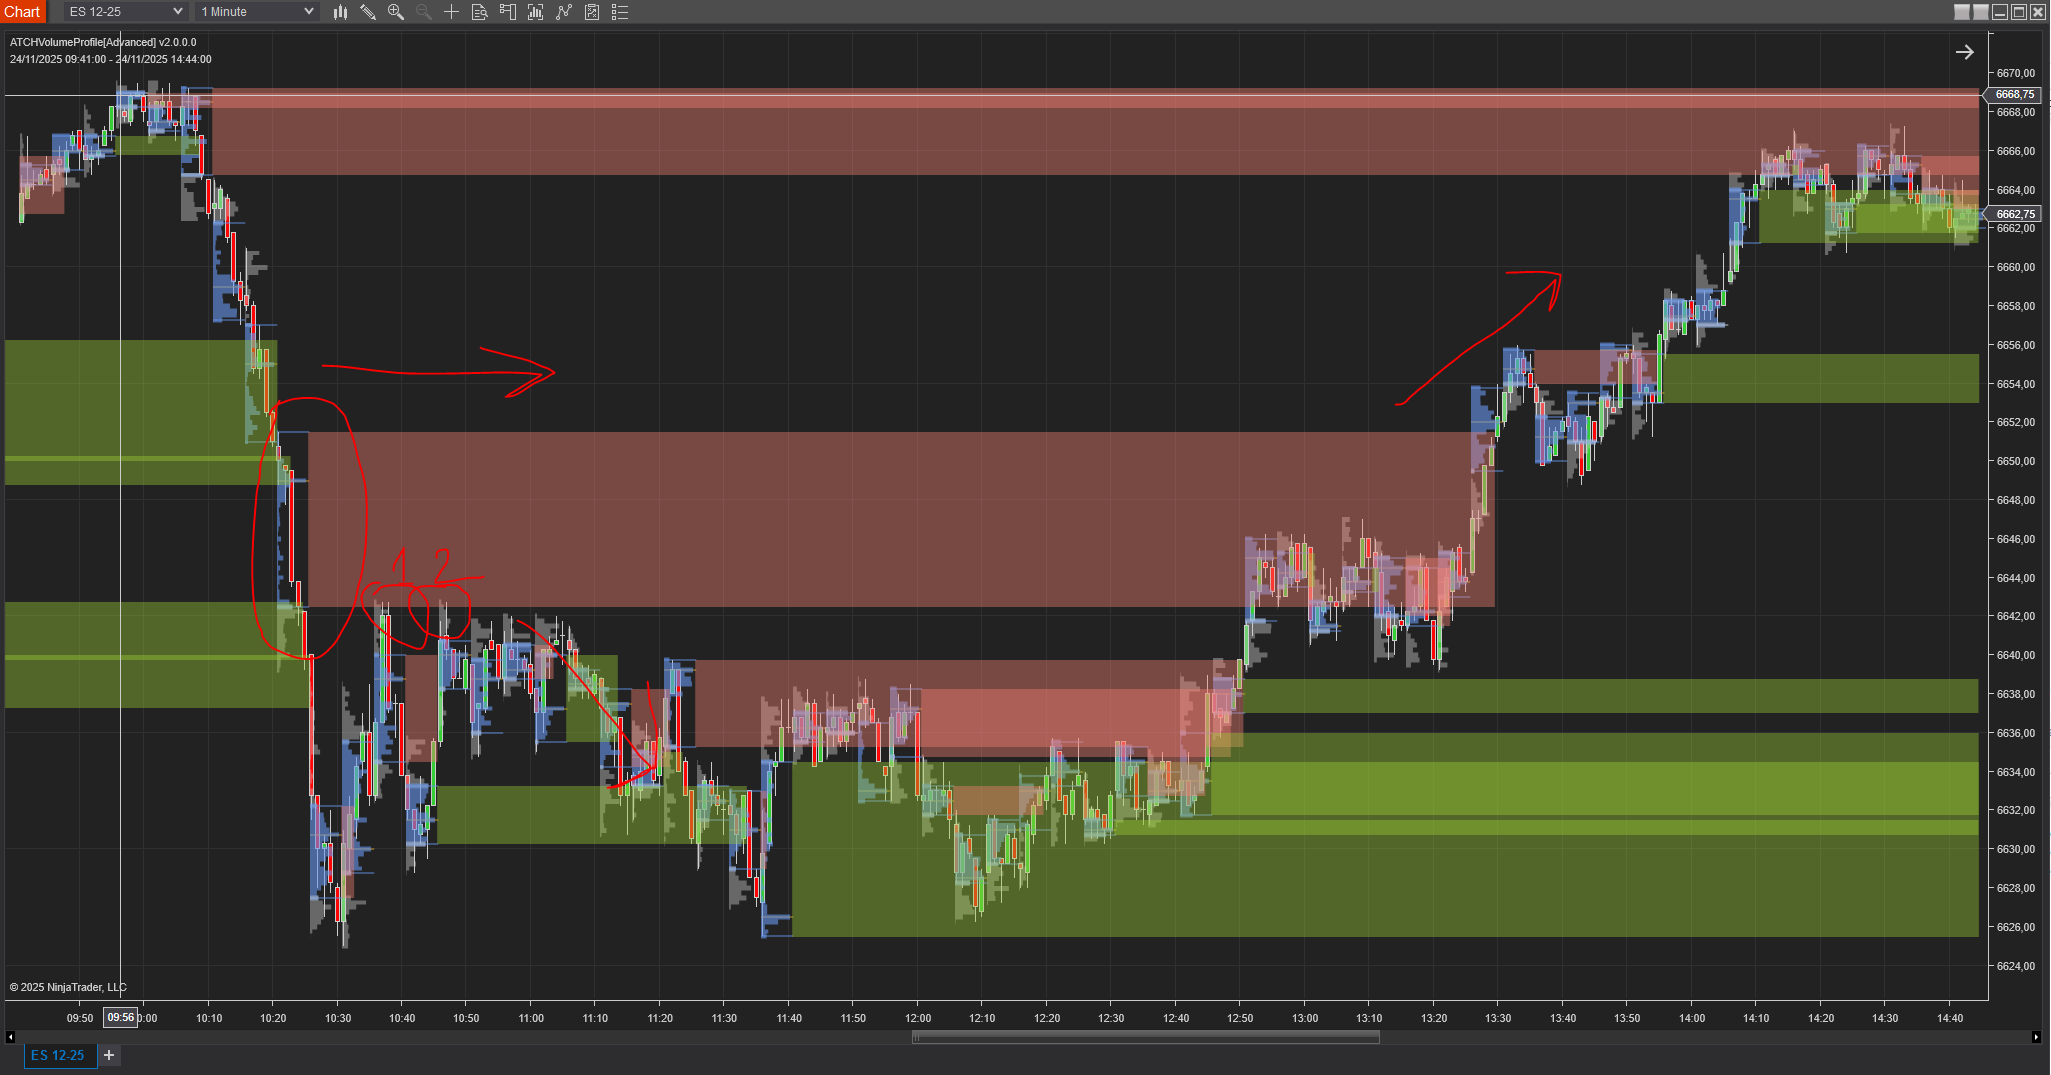
On this first example, you can see the value area zone circled in red. Then you can see that the price retraced back up and touched that zone two times. This is an indication of that value are gap playing as resistance level zone. And that it can be played to enter short trade. Not only that but it can be also used to enter long, when it gets broken.
But you may ask why did I handpicked that value area gap and didn't look at other VAGs. The answer is that one should observe the behaviour of price around Value Area gaps before deciding to enter trade. If the value area gap zone acts as support or resistance then it is a good indication that the zone is worth looking at.
One other thing to notice is that those Value Area Gaps soometimes overlap with Fair Value Gaps but not always. But from my experience looking at both, I can confirm that price respects Value Area Gaps more than it respects Fair Value Gaps.
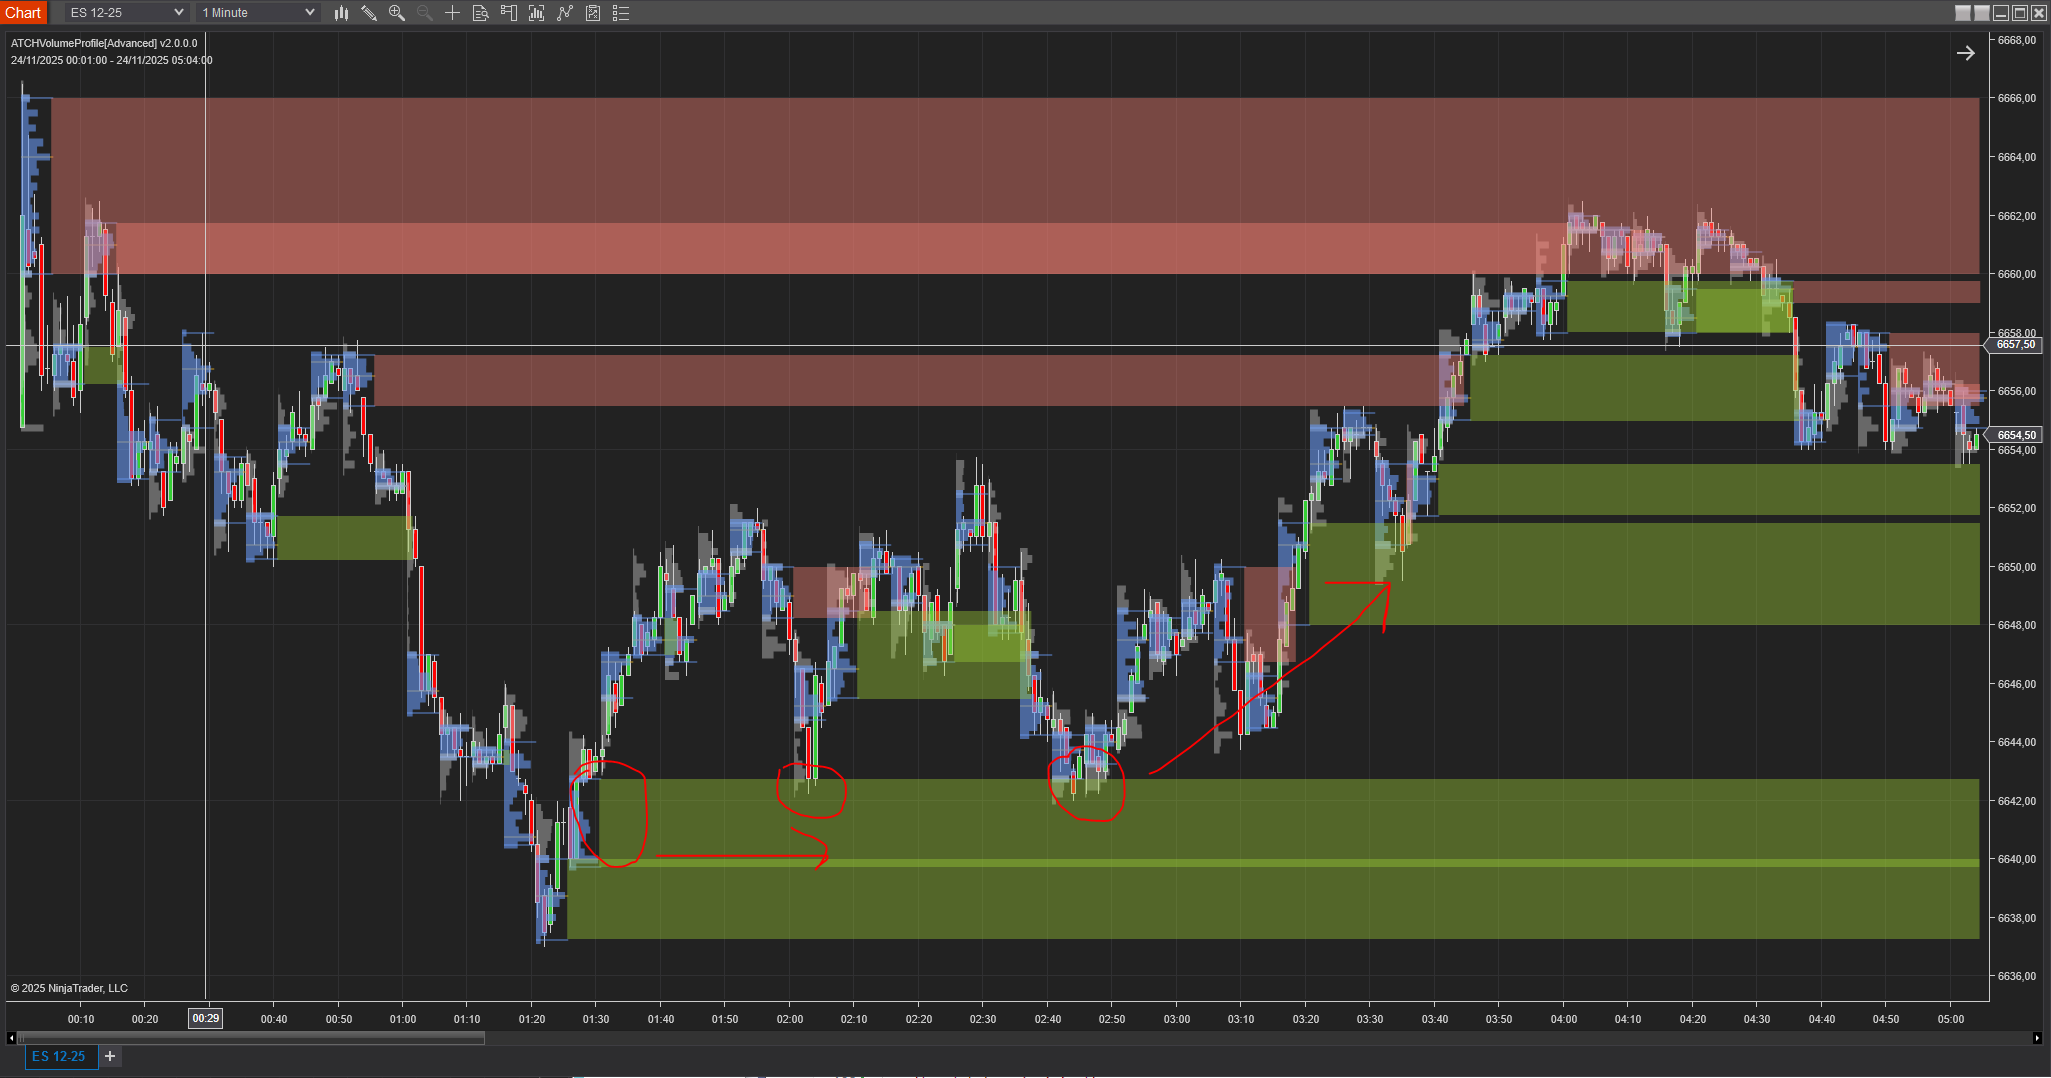
Here is a second example where price made a double bottom into othe value area zone before going straight up.
Parameters
We always try to keep the parameters to minimum.
| License | |
| License | This is the license key you get when you create an account on automated-trading.ch. After creating an account, copy your license key from the billing page. You need to set this parameter only once per month, once the license key is validated it will be remembered for the rest of the month. |
| General | |
| Use OrderFlow Data | This parameter tells the indicator if you have OrderFlow data enabled (NinjaTrader Lifetime license) or not. You should check this if you have OrderFlow. And uncheck it if you don't have OrderFlow data, in which case you should enable TickReplay on your chart for the indicator to work properly. |
| Align |
This parameter sets the drawing alignment of the profiles on the chart
|
| Profile Period |
This parameter sets the profile period type. It can have three possible values
|
| This parameter section is visible only when the Profile Period parameter is set to Sessions | |
| Time Zone |
This parameter sets the time zone to be used for setting the Session Interval parameter below. Since futures markets are open and closed based on US market time zone which is EST (US Eastern, New York), this parameter allows you to specifiy trade time interval on another timezone which is your local machine timezone
|
| Session Interval (hh:mm-hh:mm) | This parameter sets the time interval that defines the trading session.
For example if you want to draw a volume profile on the RTH session, the value of this parameter should be "09:30-16:15" |
| This parameter section is visible only when the Profile Period parameter is set to Bars | |
| Aggregate Bars Period | This parameter sets the number of bars for one volume profile. If you set this value to 1, the indicator will draw a profile for each bar. If you set this to 2, the indicator will draw one volume profile for each couple of bars. Notice that you can merge or split bars manually which will affect this initial clustering period |
| Ticks Per Level | This parameter sets the option to group multiple ticks er level. which can provide a more accurate representation of the market activity at each price level. When volume data is grouped per level, the indicator aggregates the volume for each price level, rather than showing each individual tick. This can be especially useful in markets with high volatility and wide prices such as the nasdaq (NQ or MNQ) |
| Show POC | Enable/Disable highlighting the POC level with its own color |
| Show Value Area | Enable/Disable highlighting the value area levels with their own colors |
| Value Area % | This will set the percentage used to calculate the Value Area of profiles. The value area is the area in which x% of trading volume occured. The standard value for this is 68% which represents the value are of a Normal distribution. But you can set this to other values such as 70%, in this case the value area will be calculated, on each new price tick, to show the price levels that represent 70% of the total volume of the profile. The value are is the area around the POC (Point of Control) which is the price level having the maximum traded volume |
| Show Profile Body | Enable/Disable highlighting the profile Body with a distinguish color |
| Auto Merge Profiles | This will enable/disable the automatic composition of adjacent profiles based on the overlapping of their value areas. This can be useful to automatically detect ranges of balance, and when the price breakout of those ranges in price discovery mode. Those two events can build the foundation of a trading strategy based on market auction theory |
| Machine Learning | |
| Classify Profile Type | This parameter enables classifying and displaying each Volume Profile type based on Machine Learning Algorithm |
| Profile Type Text Position | This sets the position on which to render the profile type. This can have two possible values: Top or Bottom. |
| Text Font Size | This sets the Font size of the profile type text to draw on top or below the profile |
| Profile Type Brush | This sets the color of the profile type text |
| Text Opacity (1-100) | This sets the text color opacity of the profile type text |
| Value Area Gaps | |
| Show Value Area Gaps | This will enable/disable drawing of Value Area Gaps |
| Mitigation Method |
When price hits the Value Area Gap (VAG) after its formation, it is said to be "mitigated" and it stops from further extending. This parameter allows to chose which
mitigation method is used to set whether an VAG is considered mitigated by the price:
|
| Stop Showing Mitigated | This parameter will hide VAG drawing once they are mitigiated allowing for a more clean chart |
| Stop Extending @ New Day | This parameter will make the VAG zone drawing stop from extending into a new day even if it is not mitigated |
| Show 50% Level | This parameter will draw consequent encroachment (50%) on the VAG zone |
| Shrink VAG | This parameter will shrink the drawing of VAGs each time it is touched by the wick of a candle |
| Bullish Color | The Brush color to draw bullish VAGs |
| Bearish Color | The Brush color to draw bearish VAGs |
| Render Opacity (1-100) | The Brush opacity to draw VAGs from 1 (transparent) to (100) opaque |
| Rendering | |
| Profile Width % | This parameter sets the profile width in percentage of the total with of the candle bars(s). The value of 100 will fill the whole area. |
| Profile Opacity | The opacity to render the body of the profile. I personally set this value to 40 |
| POC Render Mode |
This parameter has two values:
|
| Value Area Render Mode |
This parameter has two values:
|
| Value Area Opacity | The opacity to render the value area of the profile. In general you would want to set this to a slightly higher value than the body opacity to create a clear contrast between the two areas |
| Profile Body Color | Draw Color of profile levels other than the POC and value area levels |
| POC Color | Draw Color of the POC level (point of control) |
| POC Opacity | Opacity the POC level (point of control) from 1 (transparent) to 100 (opaque) |
| Value Area Lines Thickness | Line thickness of the Value area high line and value area low line |
| POC Thickness | Line thickness of the POC line |
| Value Area Color | Draw Color of the value area levels |
| alue Area Line Opacity | Opacity the Value area lines from 1 (transparent) to 100 (opaque) |
| Show Labels | Enable/Disable showing pivot levels labels |
| Label Font Size | This sets the font size of the labels if they are enabled |
Interactive Commands On the Click & Drag Mode
| Extend To Last Bar | |
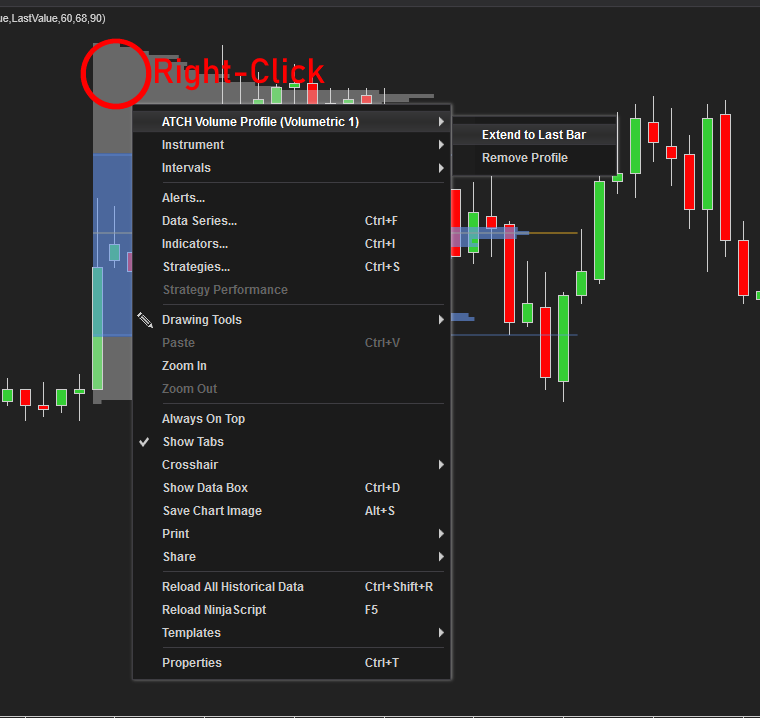
|
The Extend to Last Bar command will extend the clicked Volume Profile until the most recent bar on the chart. Hence, the volume profile will be active and it will be extended to new bars created and it will be recalculated at each new tick |
| Stop Extending | |
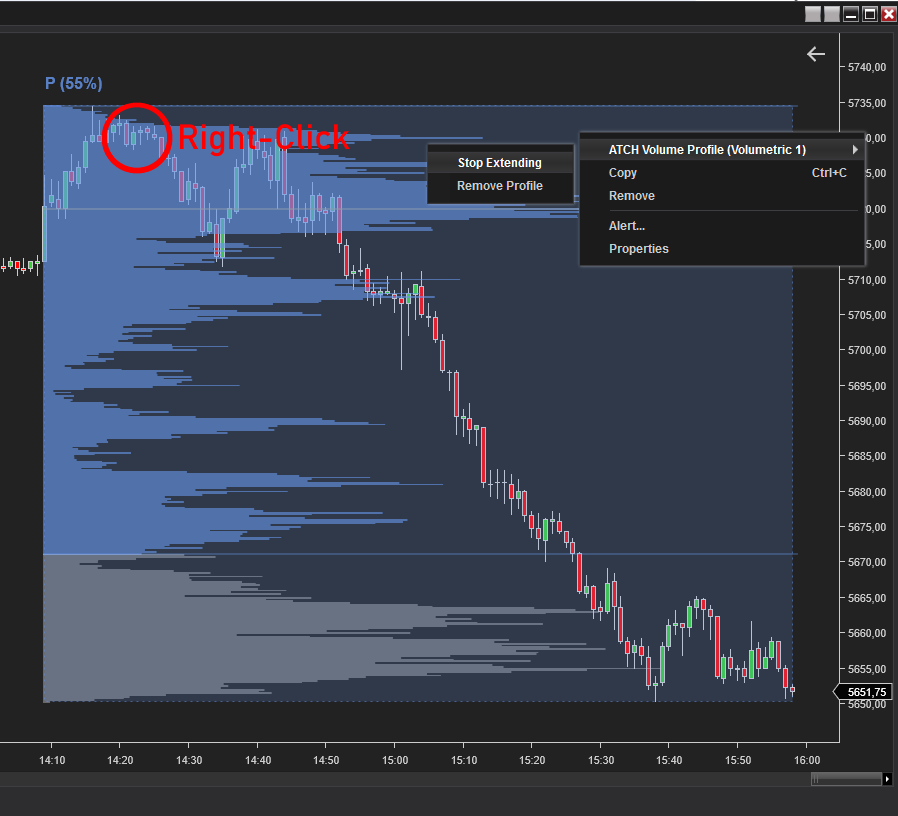
|
The Stop Extending command will mark the clicked Volume Profile as inactive and it will stop extending it to new bars |
| Remove Profile | |
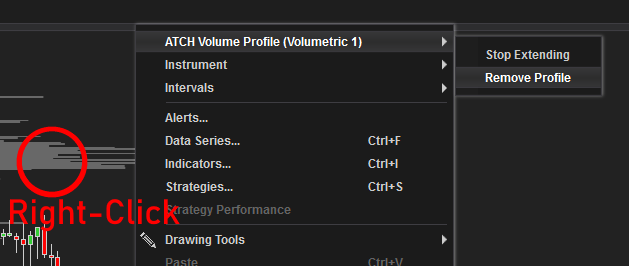
|
The Remove Profile command will remove the profile from the chart. This is required as the "Delete" Keyboard button cannot be used to remove the profile, so this menu entry was created for this purpose. |
Interactive Commands On the Bars Mode
Interactive commands are operations of merge/split that can be applied to volume profiles on the chart by right-clicking on them
| Merge Right | |
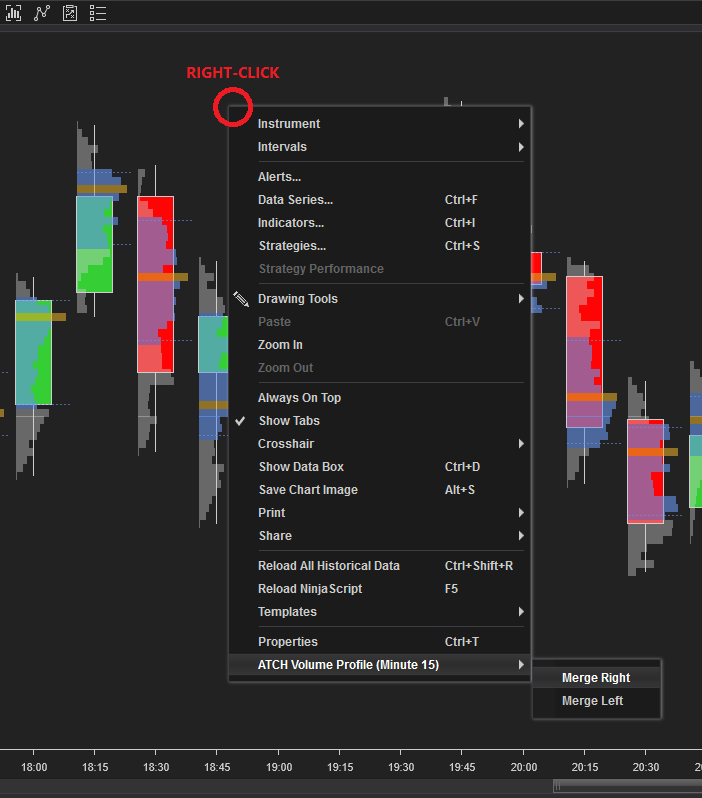
|
This command is accessible on Right-Click on the chart on a Volume profile item. If the clicked profile has a successor profile, this Context-menu button will be visible and you can click it to merge the selected profile with its right-hand profile. The result of this merge will be the concatenated profile from the two profiles. Profile before merge: 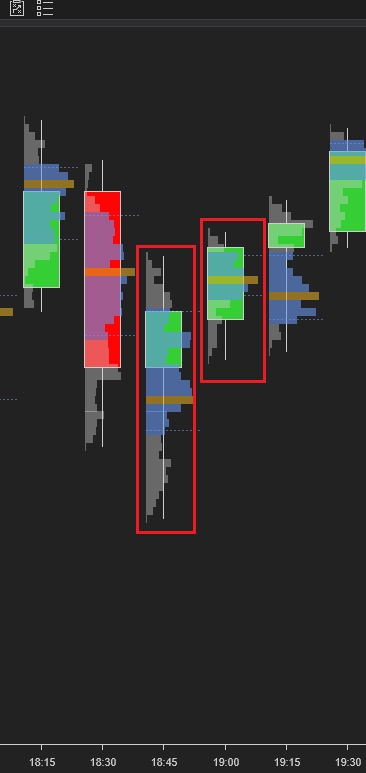
Profile after merge: 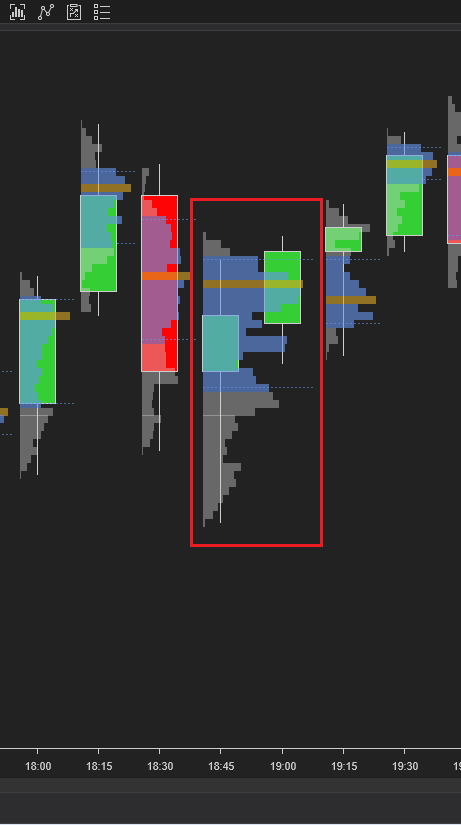
The resultant composite profile can be further composed with its right or left profiles |
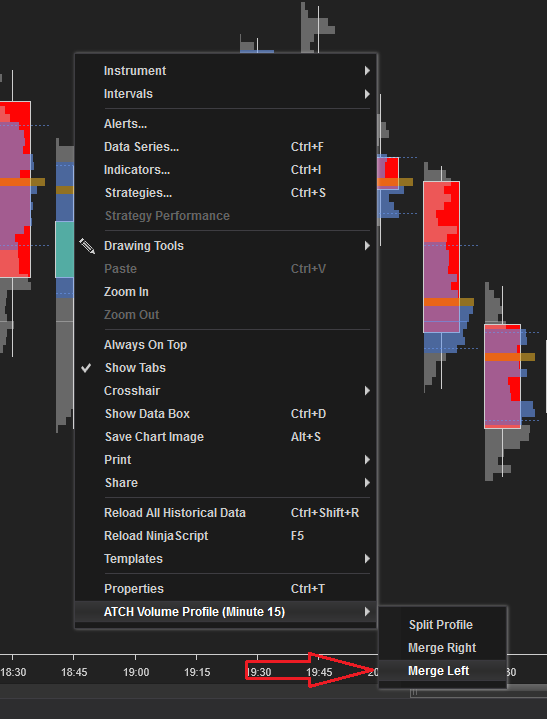
| Merge Left | |
|
This command is accessible on Right-Click on the chart on a Volume profile item. If the clicked profile has a prdecessor profile, this Context-menu button will be visible and you can click it to merge the selected profile with its left-hand profile. The result of this merge will be the concatenated profile from the two profiles. The resultant composite profile can be further composed with its right or left profiles |
| Split Profile | |
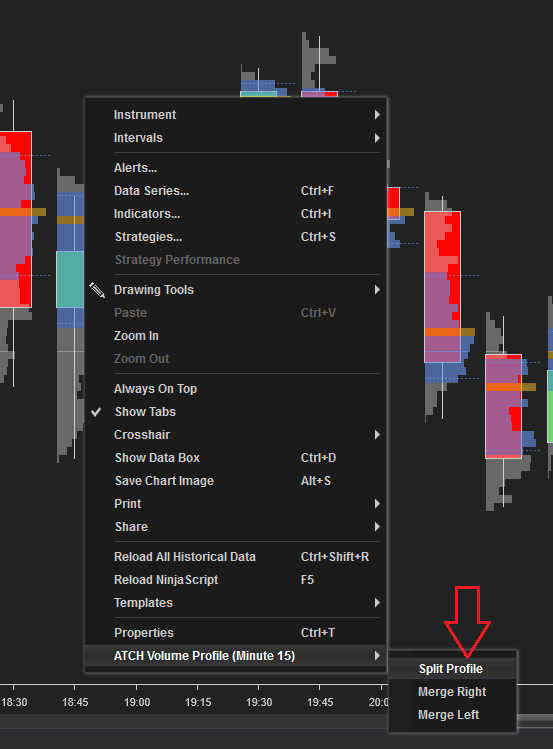
|
This command is accessible on Right-Click on the chart on a Volume profile item. If the clicked profile is composed of more than one candlestick, this Context-menu button will be visible and you can split the selected profile into multiple unit profiles. The split profiles can be re-merged afterwards. |
Signals & Usage in Strategy Builder
The indicator in its newer version starting from 2.0.0.0 no longer can be used as signal generator on other platforms
Download & Installation Instructions
To download and install the indicator follow the instructions below
- Click on the below download button to download the Indicator file
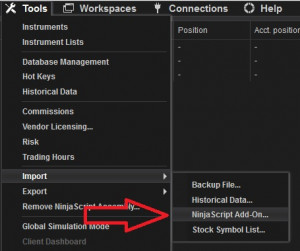
- Import the downloaded .zip file into NinjaTrader using the import NinjaScript menu item
- Next, open a new chart window
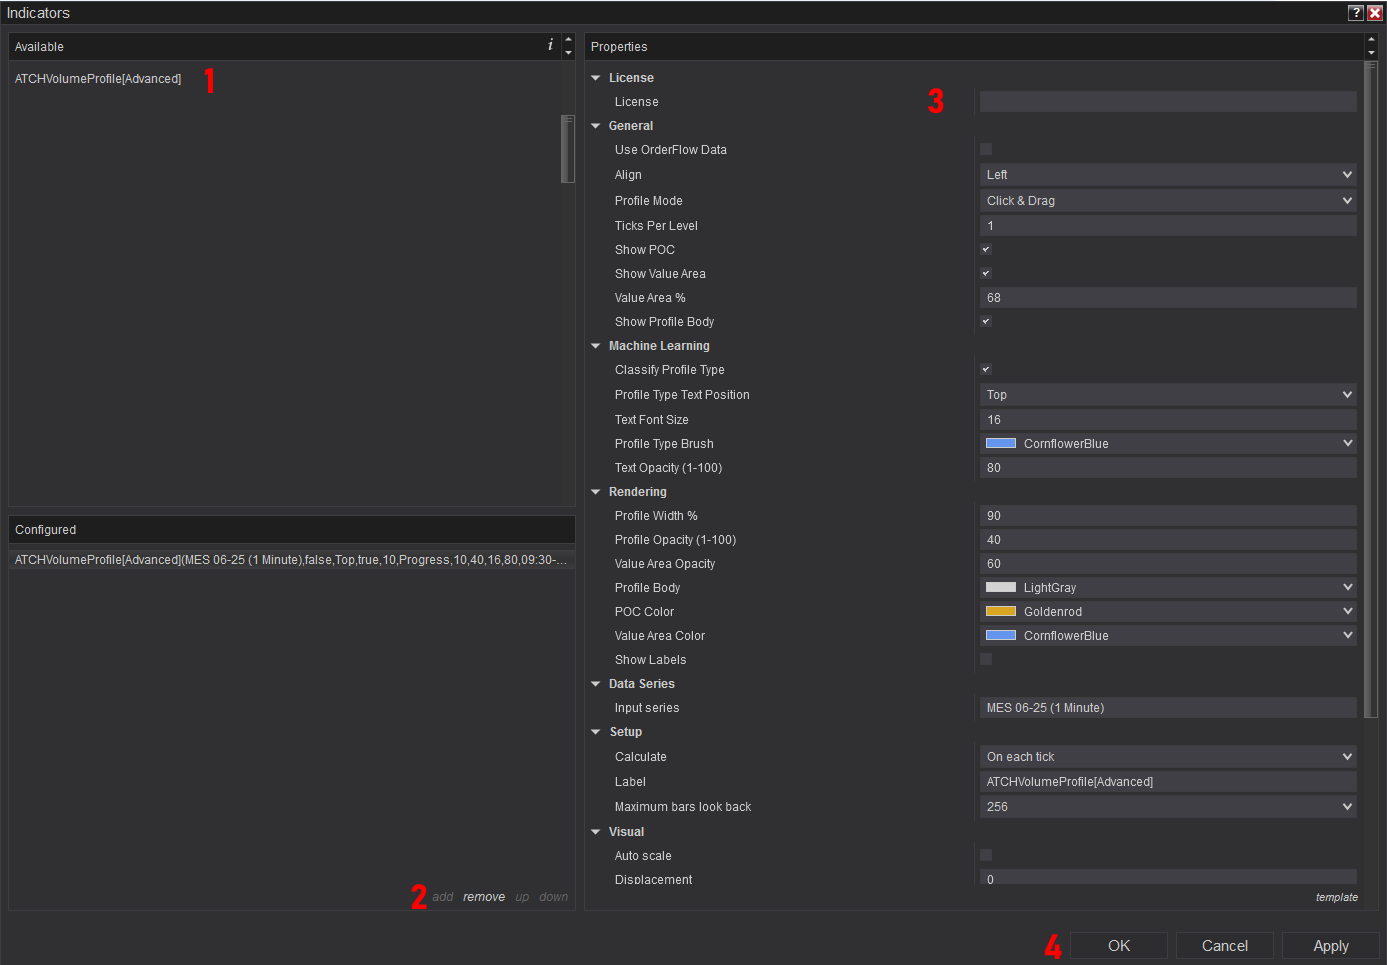
- After installing the indicator and opening a new Chart window you should add the indicator to the chart. Right-click on the chart and click on Indicators...
- Copy/Paste your license key that you can find on the Billing page into the license parameter
- The indicator requires the Premium Subscription. Check the Pricing page for details
- After adding the indicator to the chart with a valid license, the indicator will be run on Historical data loaded on the chart.
- After that, the indicator is added with success and will continue to run on live market data

Frequantly Asked Questions
General
Yes, If you have an idea that you believe can improve this indicator, I will be more then happy to hear from you. Please use the contact page to send me a message
No, the source code of the indicator is protected for copyright reasons
Yes, this indicator Exposes the POC and Value Area values through Plot series that can be used from within a strategy
Yes you can use this indicator without TickReplay if OrderFlow is enabled on your NinjaTrader platform
Release Notes
- on Bars mode : stop volume profile at end of session to avoid inconsistant intraday aggregation of volume profiles
- Fix bug : start of session volume profile is one bar prior to actual start time on higher than 1 minute timeframes
- Fix bug : on historical mode, session volume profile is not shown when chart ends before session end time
- Fix bug : value area gaps are not showing
- Added Value Area Gaps
- Fix bug : drawing of chart freezes the indicator when switching to realtime.
- Fix Bug : last bar is not calculated when Bars mode is selected and indicator switches to real time
- Added 100% asynchronous loading of data which makes the indicator lag and freeze proof
- Added progress bar to show progress of data processing while chart processes price in realtime
- Added POC line opacity and Value area lines opacity parameters
- Added POC line Tickness and Value area lines thickess parameters
- Add POC and Value area progress render mode on click and drag mode
- Various bug fixes making the indicator robust and stable
- Fix Bug : indicator hides Grid lines when added to chart
- Bug Fix not showing profiles when in CET timezone
- Bug Fix drawing Volume profiles on bars mode
- Fix POC & Value Area progress mode on Bars period on Tick Replay
- Speed up calculation by optimizing calculation of POC Progress mode
- First Release of the indicator
User Comments & Feedback
You can find feedback of our users and ask questions about this strategy by joining our discord community by following this invite link or clicking on the Discord logo image. Joining is completely free
![]()