

Chart Scanner AI Indicator for NinjaTrader 8
 Created 15 Aug 2025
·
Updated 23 Aug 2025
Created 15 Aug 2025
·
Updated 23 Aug 2025
The Chart Scanner AI is a Free indicator for the NinjaTrader 8 platform that integrates two object-detection AI models to recognize chart patterns and buy/sell signals directly from the visual appearance of your chart.
Prerequisites
To properly use this indicator you should have the following prerequisites available.
- NinjaTrader 8, with any license type. Click here to download
- The .NET 8.0 Runtime, available from Microsoft.
- Order Flow data is not required to use this indicator — no Lifetime license is needed.
- An automated-trading.ch account with an active Free account (no paid subscription required)
Description
The Chart Scanner AI Indicator integrates two object-detection AI models:
- Stock Market Pattern Detection Model — an object-detection model based on the YOLO (You Only Look Once) framework, designed to detect various chart patterns in real time from screen-captured trading data. It has been fine-tuned on a diverse dataset (9,000 training images and 800 validation images) and provides output across 6 classes: Head and Shoulders Bottom, Head and Shoulders Top, M_Head, StockLine, Triangle, and W_Bottom.
- Object Recognition Algorithm and "Buy-Sell Decision" Model over 2D candlestick charts — also built on the YOLO framework, this model identifies and classifies candlestick patterns into two classes: Buy and Sell.
The indicator is split into two programs. The first is the indicator itself, installed on NinjaTrader. The second is ATCHChartScan.exe, a companion program you download and place in any folder on your computer. The indicator looks for ATCHChartScan.exe at runtime and calls it following this logic:
- The indicator detects when the chart has updated.
- Once updated, the indicator takes a snapshot of the chart with no drawings on it.
- The indicator sends the image, along with its settings, to ATCHChartScan.exe.
- ATCHChartScan.exe processes the image and normalizes its colors to a white background, since the models were trained only on white-background charts.
- ATCHChartScan.exe runs the models on the image and returns the bounding-box results to the NinjaTrader indicator, which draws them on the chart.
- The indicator runs this processing logic on every new real-time bar formed on the chart.
- When the indicator is removed from the chart, it cleans everything up and makes sure ATCHChartScan.exe is properly disposed of.
- Pattern detection is based solely on the chart's image, not on price data — the slightest change in chart dimensions, zoom, stretch, or the NinjaTrader theme used can affect the detection result. This is why this indicator should be considered experimental.
- ATCHChartScan.exe saves the processed image to a file named chart_dump.png, found in the same directory as the executable.
Examples
Let's look at a few examples of the indicator in action.
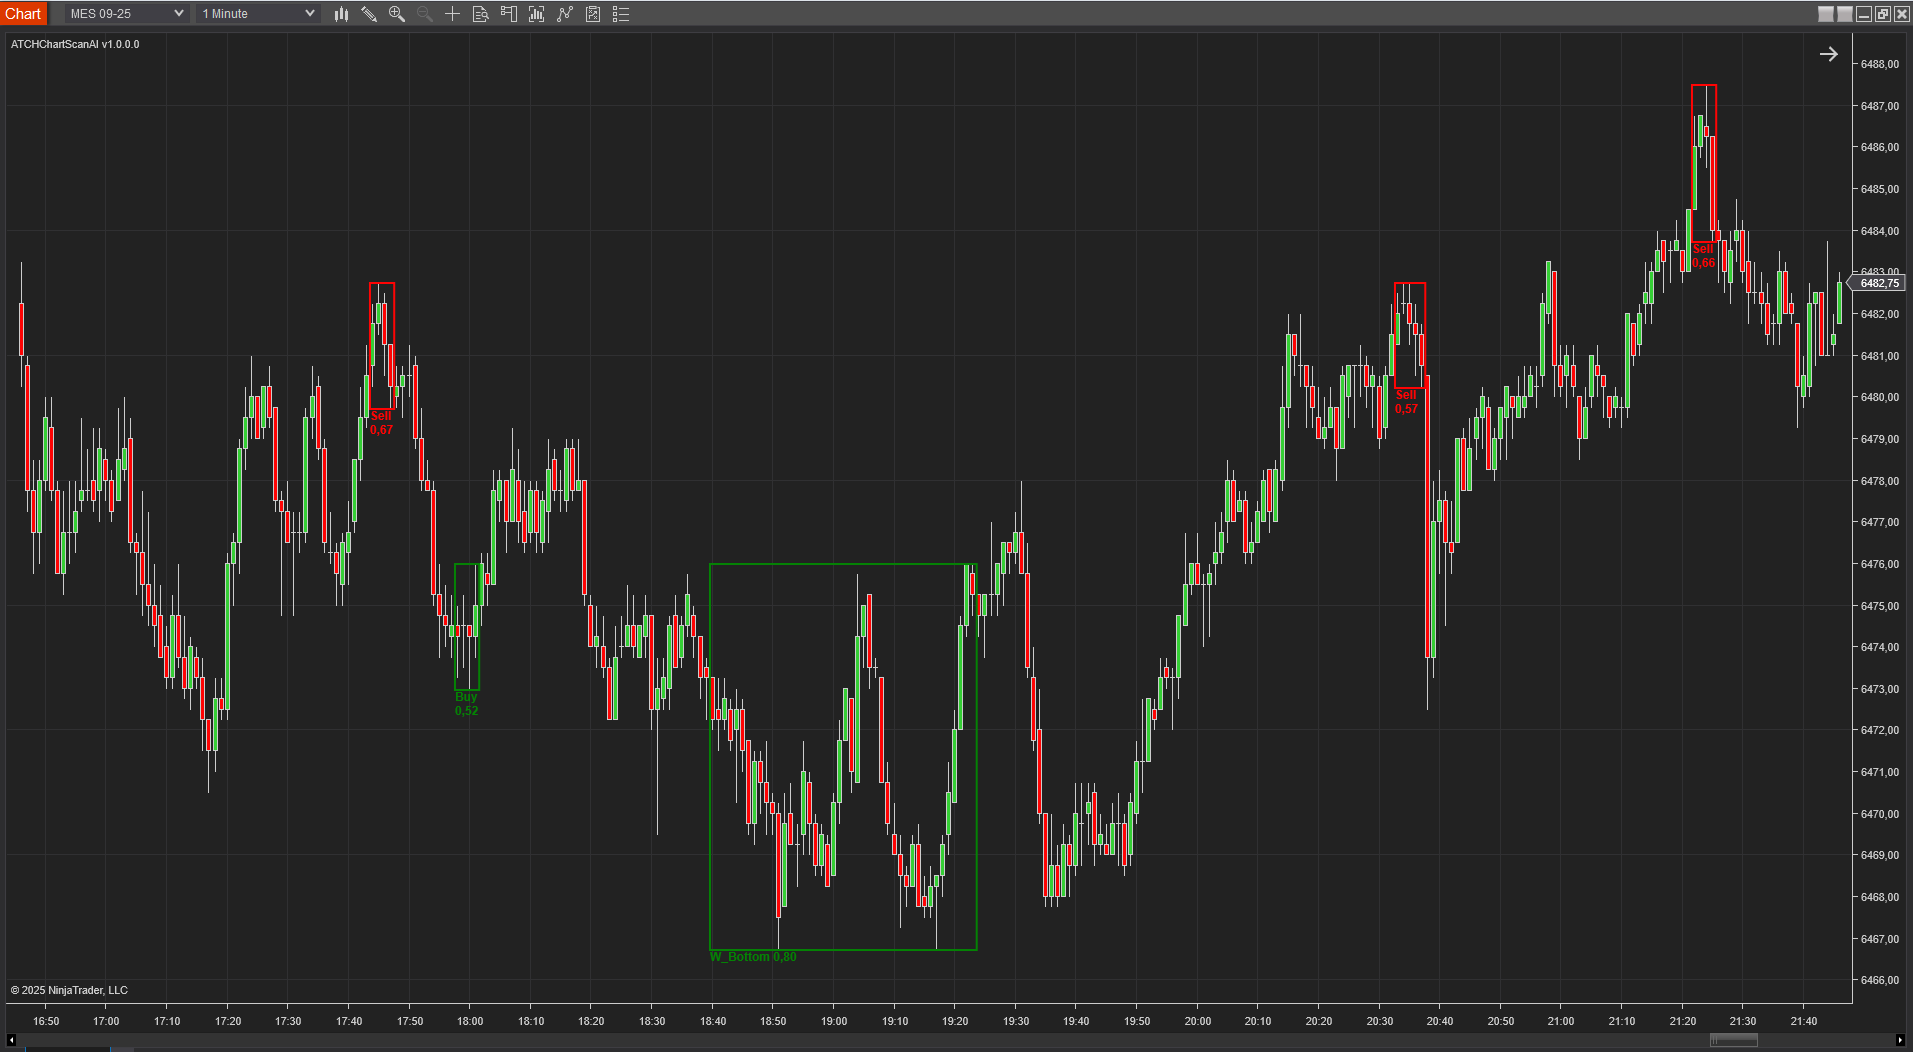
Patterns on MES, 1-Minute
The indicator draws rectangles in red and green — red for bearish patterns, green for bullish patterns.
- Below each rectangle is the pattern's label — "Buy", "Sell", "W_Bottom", etc. — the class recognized by the model.
- Next to each label is the confidence score, a number between 0 and 1 that scores the pattern's validity. A score of 1 would mean the model is 100% confident, though in practice the confidence score never reaches exactly 1.
- The indicator lets you control the minimum confidence level displayed on the chart.
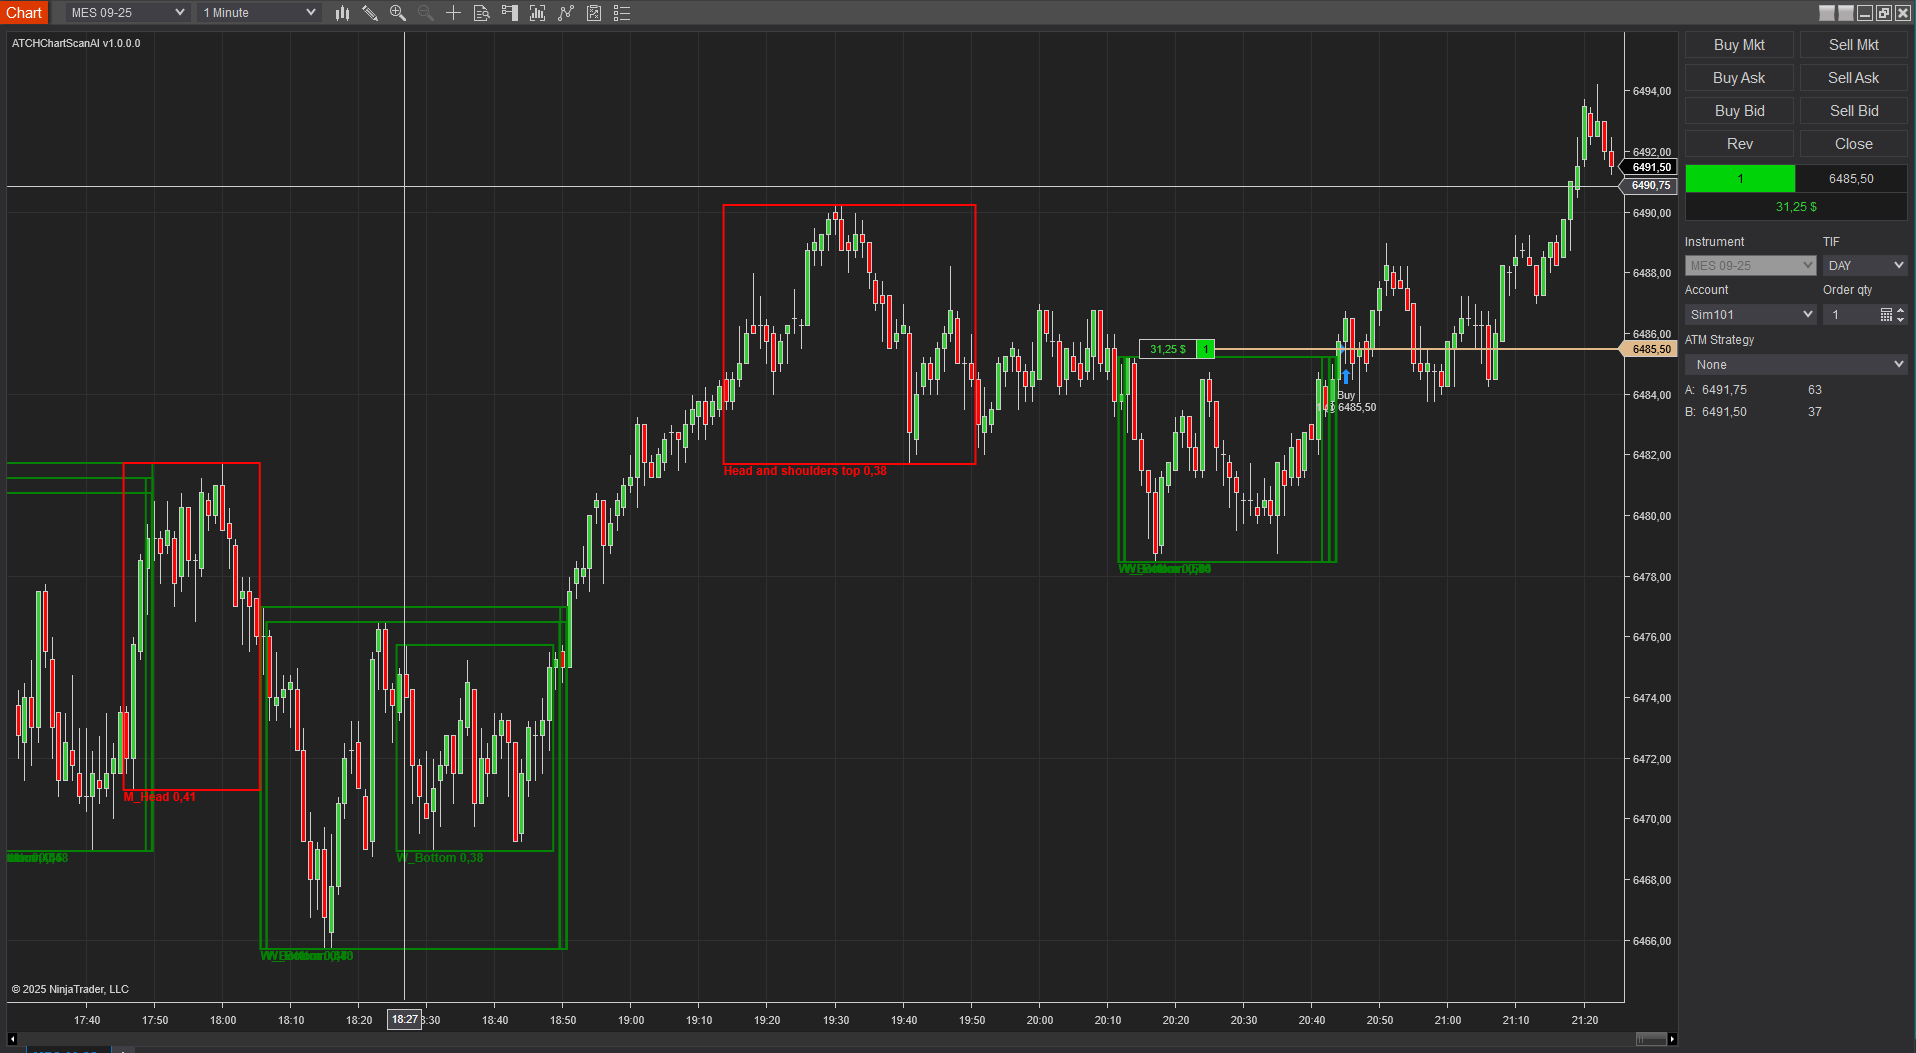
Bullish Pattern and Entry on MES, 1-Minute
In this example, the recognition model identified a W_Bottom pattern right at the chart's last real-time bar, leading to a profitable entry on a Sim account — demonstrating that the indicator can produce real-time pattern signals, not only patterns on historical data.
Parameters
We always try to keep the parameters to a minimum.
| License | |
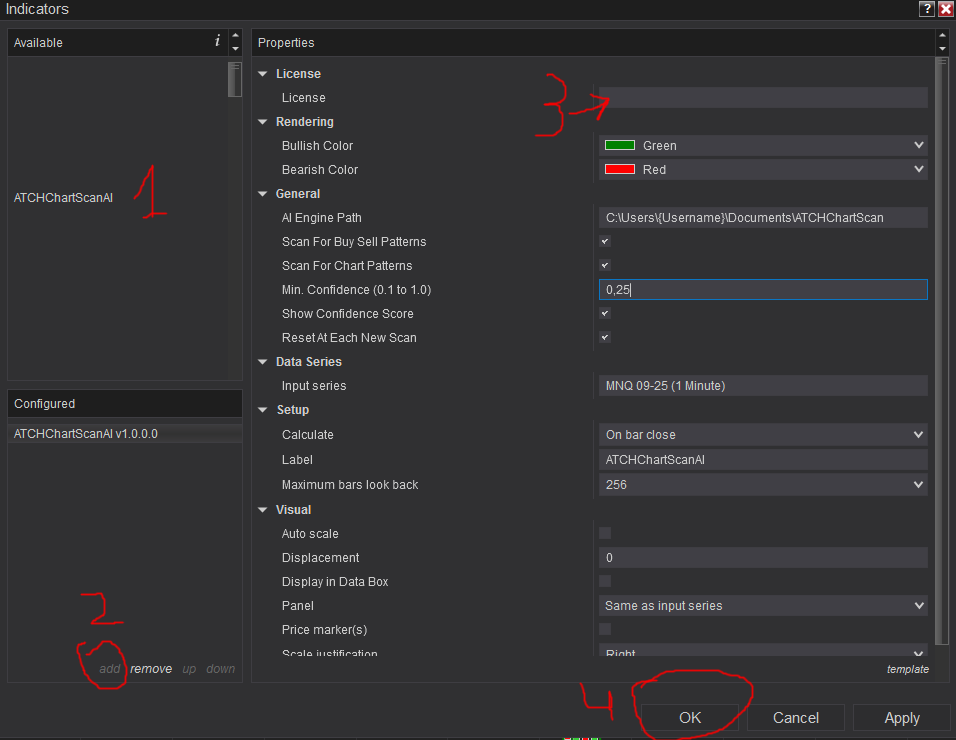
| License | The free license key you get when you create an account. After you create an account, copy your license key from the billing page. You only need to set this parameter once per month — once validated, it's remembered for the rest of the billing cycle. This indicator is entirely free to use, but you need to register for a free account and license to run it. |
| General | |
| AI Engine Path | The path to the folder where you've installed ATCHChartScan.exe. |
| Scan For Buy Sell Patterns | Enables/disables calling the Object Recognition Algorithm and "Buy-Sell Decision" Model to scan for Buy/Sell patterns. |
| Scan For Chart Patterns | Enables/disables calling the Stock Market Pattern Detection Model to scan for more complex chart patterns. |
| Min. Confidence (0.1 to 1.0) | Sets the minimum accepted confidence for detected patterns. 0.1 is the minimum value, 1.0 the maximum. |
| Show Confidence Score | Shows/hides the confidence score and pattern name drawn on the chart. |
| Reset At Each New Scan | Removes all detections and chart drawings each time the detection engine is called. When disabled, each newly drawn pattern is kept from call to call. |
| Rendering | |
| Bullish Color | The color used to draw bullish patterns. |
| Bearish Color | The color used to draw bearish patterns. |
Download & Installation Instructions
License Requirements
At automated-trading.ch you can choose to either purchase a monthly subscription to use our premium products, or use our free products without subscribing.
In both cases, you need to create an account so you can get a License you can use for both premium and free products.
To obtain your license, simply sign up and then get your license on the billing page.
Download
You can also download this strategy — and every other automated-trading.ch strategy or indicator — anytime from your centralized Downloads page.
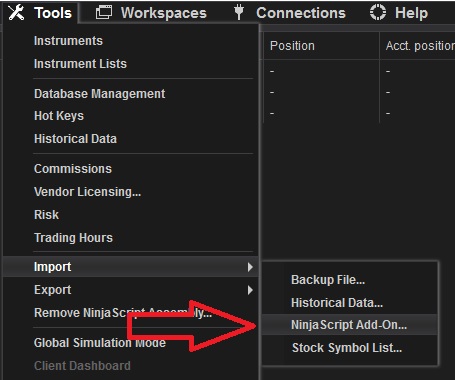
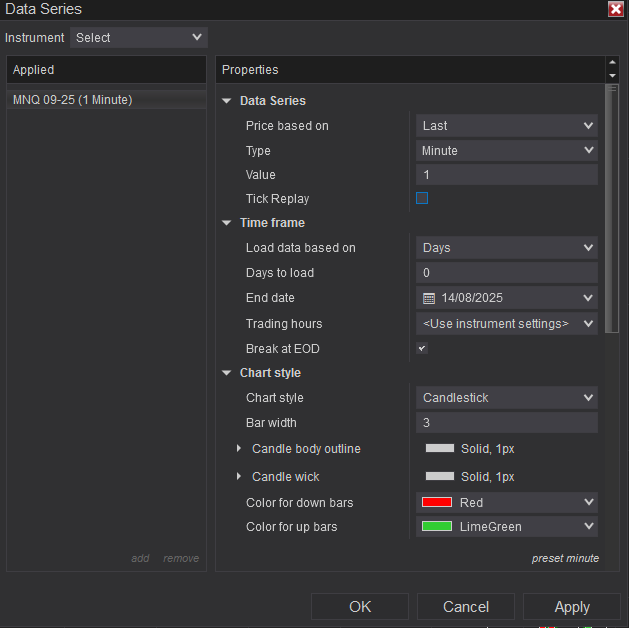
Installation Steps
Frequently Asked Questions
General
Release Notes
- Fix ATCHCharScan.exe ArmDot issue
- Fix License verification Logic
- First Release of the indicator