Index
Prequisites
To use this indicator you should have available the following prequisites
- NinjaTrader 8. Click here to download
- Order Flow data is Not required to use this indicator (you don't need to have a Ninjatrader Lifetime license)
- automated-trading.ch account to obtain a free license key. To obtain the license key, simply Signup and then get your license on the billing page
Description
The Lorentzian Classifier indicator for Ninjatrader 8 is an indicator that provides bullish/bearish signals based on a machine learning classification model. This classification model is built on the Lorentzian distance measure to find similarities between features extracted from a block of price bars.
The lorentzian classifier is a special type of distance measure that is able to classify features on a multi-dimensional space which is a novel way to implement Nearest-Neighbour algorithmes. By using the lorentzian distance, the indicator can find similar block of price action in historical training data and infere the next bar outcome based on voting from these most similar historical feaures.
Here are the steps that the indicator executes to predict the next price action outcome and attribute a score to this prediction:
- The first step is to consider a period of bars to analyse: The indicator uses a period parameter which is a number of bars to analyse. On each new bar closed on the chart, the indicator will take the last X bars to perform its analysis. Only those X bars are taken into consideration and as new bars are open and closed, the sliding window of the last X bars progresses.
- The second step in the process is to extract features on those X last bars. The features calculated are not based on any indicator values but rather on context-based Time, Price and Volume values
- Th next step in the process is to use the Lorentzian distance algorithm to find the most similar features among the training data that is loaded when the indicator is initialized
- The most similar features are used to decide the next X bars outcome which is a parameter that can set.
A number of X similar samples are taken, the number taken samlples can be manually set using the
Voting Count parameter, or it can be calculated automatically if the Voting Count parameter is set to 0 - The next step is to let those most similar samples vote for the outcome. Each similar sample from the training data will vote whether the next candle will be a bullish candle or a bearish candle. At the end of this step, the average outcome is calculated as the predicted outcome price movement in points for the next N candle price action.
Examples
Lets start by showing some example of the indicator in action
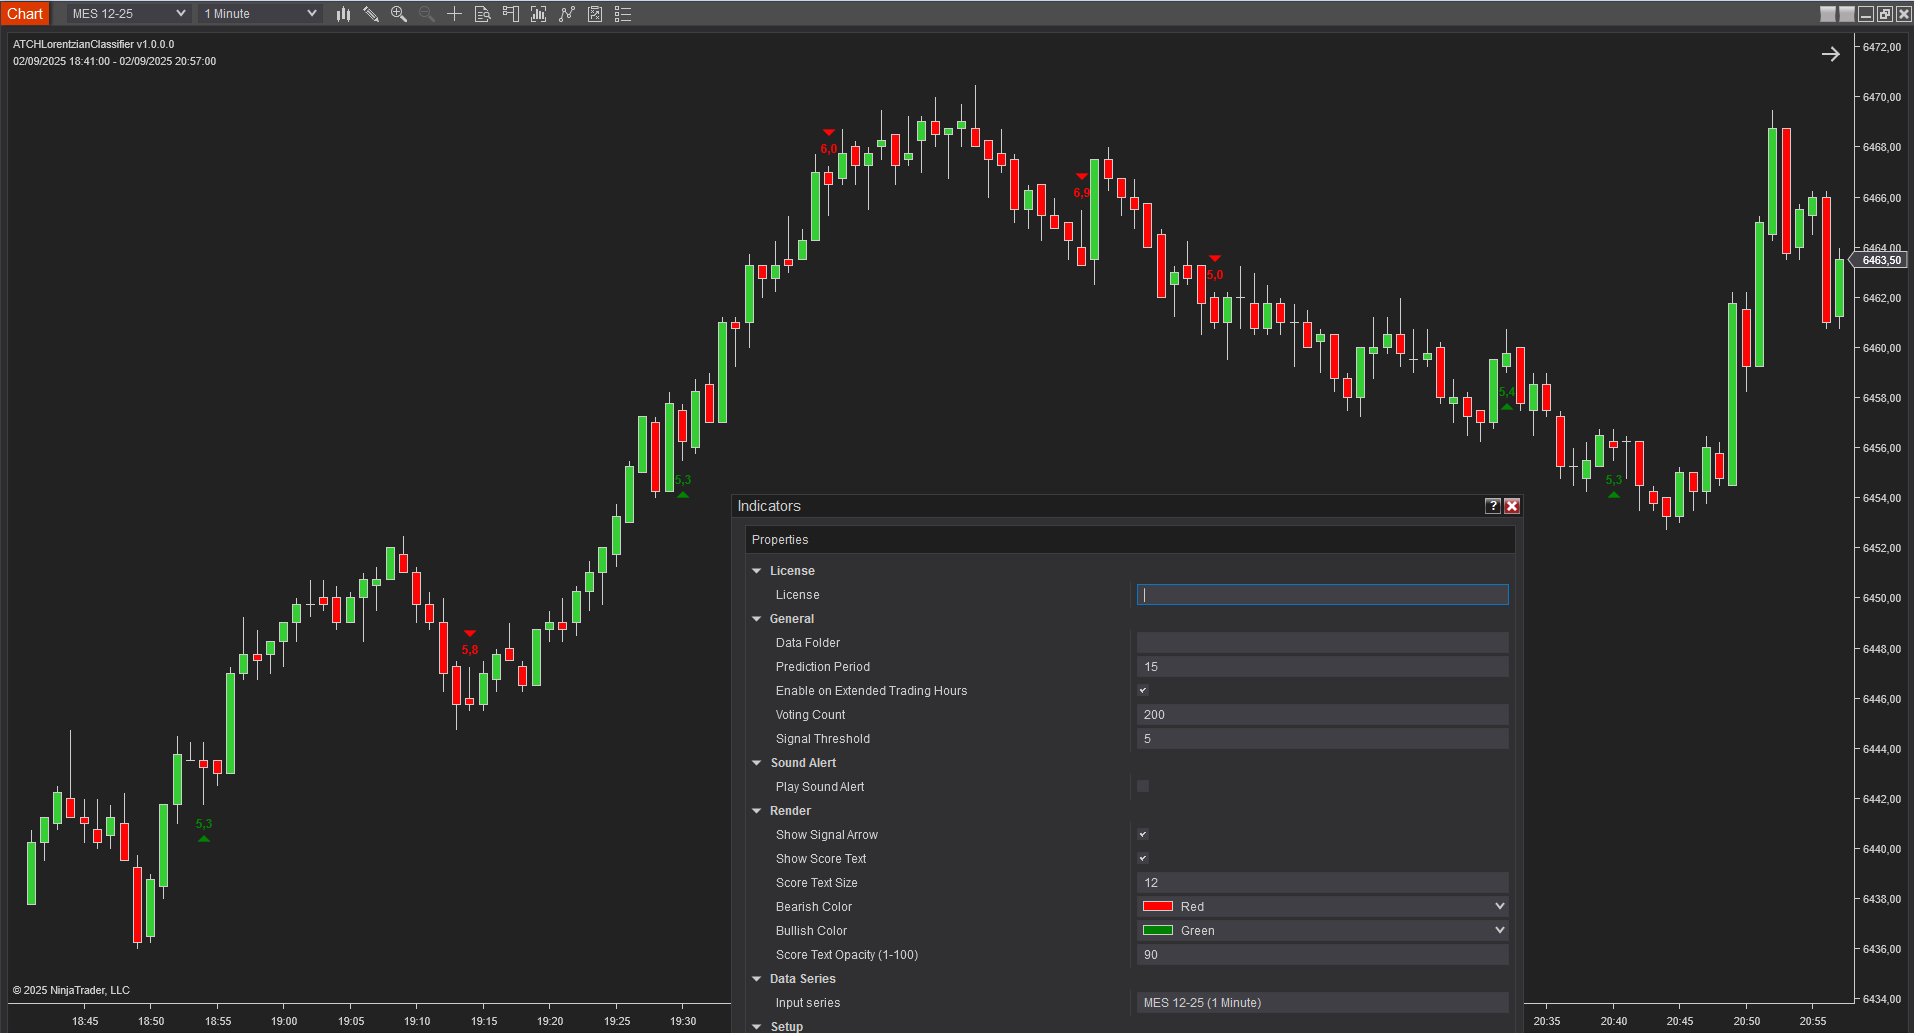
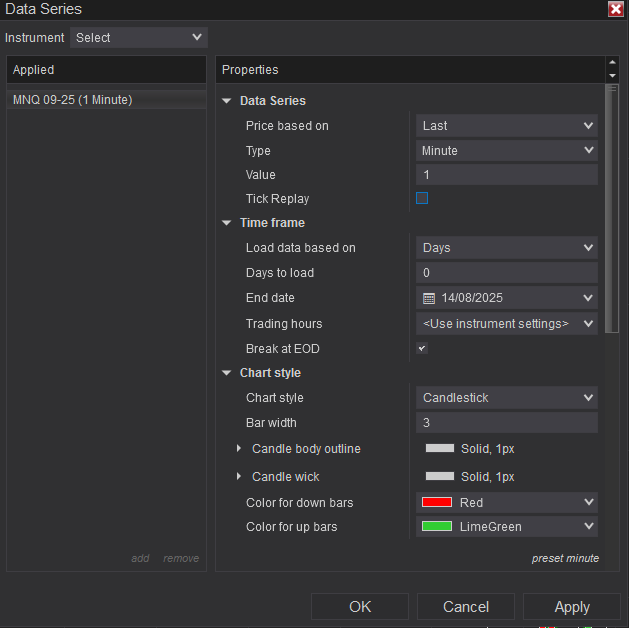
On the below example, you can see the indicator on its most simple usage scenario. Running on the MES symbol (Micro ES which is the S&P500) on the 1 Minute timeframe. You can see on the screenshot Below the used parameters. As you can notice the usage of value of 5 as the threshold which will filter out all signals which have a score lower than 5. That leaves some signals that have high probabilities, the green arrows are bullish signals and red arrows are bearish signals.
The time interval of the day on that example is the RTH session (Regular time hours : from 09:30 to 16:30 EST). Notice that the time of day has a big impact on the quality of signals. Remember that the indicator classification algorithm is based on a context measure of prices which takes into consideration the time and volume of the price bars. And as you know the volume of MES and and US Futures is a lot higher during RTH than during ETH (extended time hours)
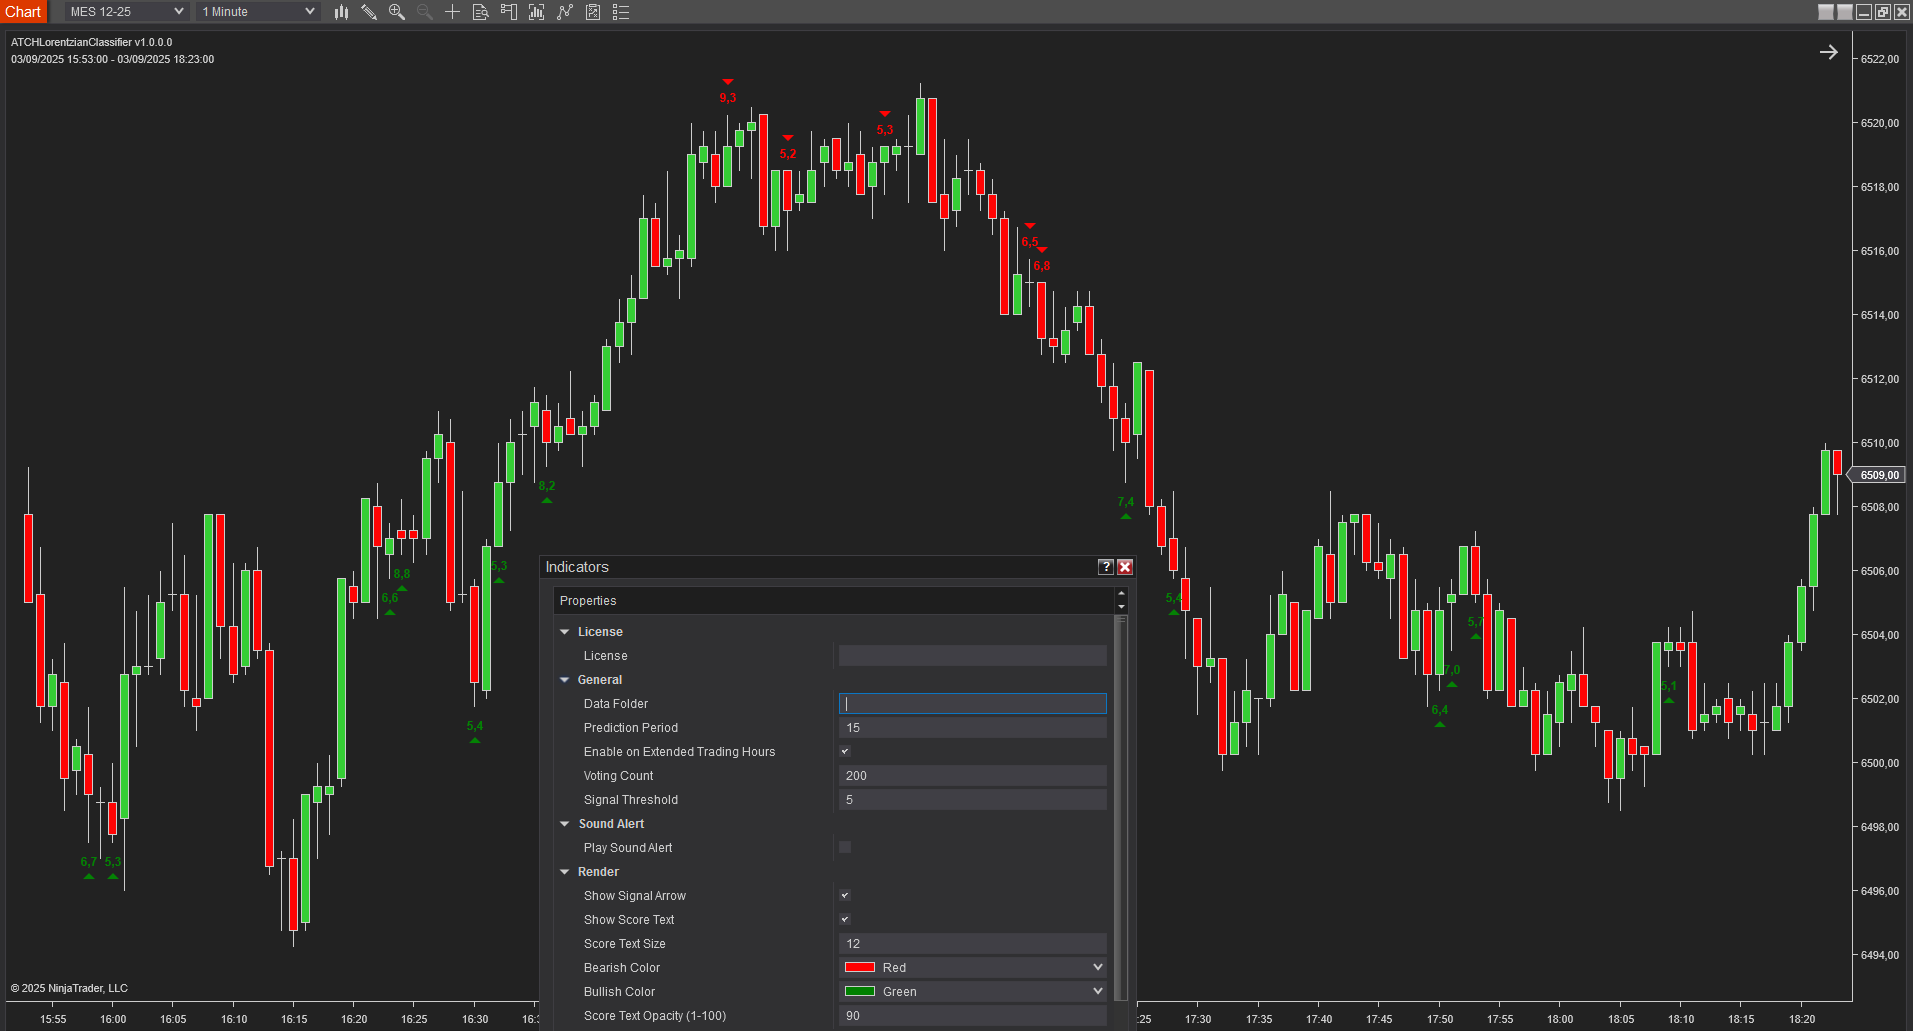
This second example has the same parameters as the previous one. and it shows more signal arrows drawn on the chart. You can see that some arrows are of good quality and some are irrelevant. For example, you can see some green bullish arrows been drawn on a bearish trend going down. But those bas signals can be easily ignored by looking into the very next bar of where the signal occured. On the other hand, you can spot some very good signals that do predict change of market regime and trend.
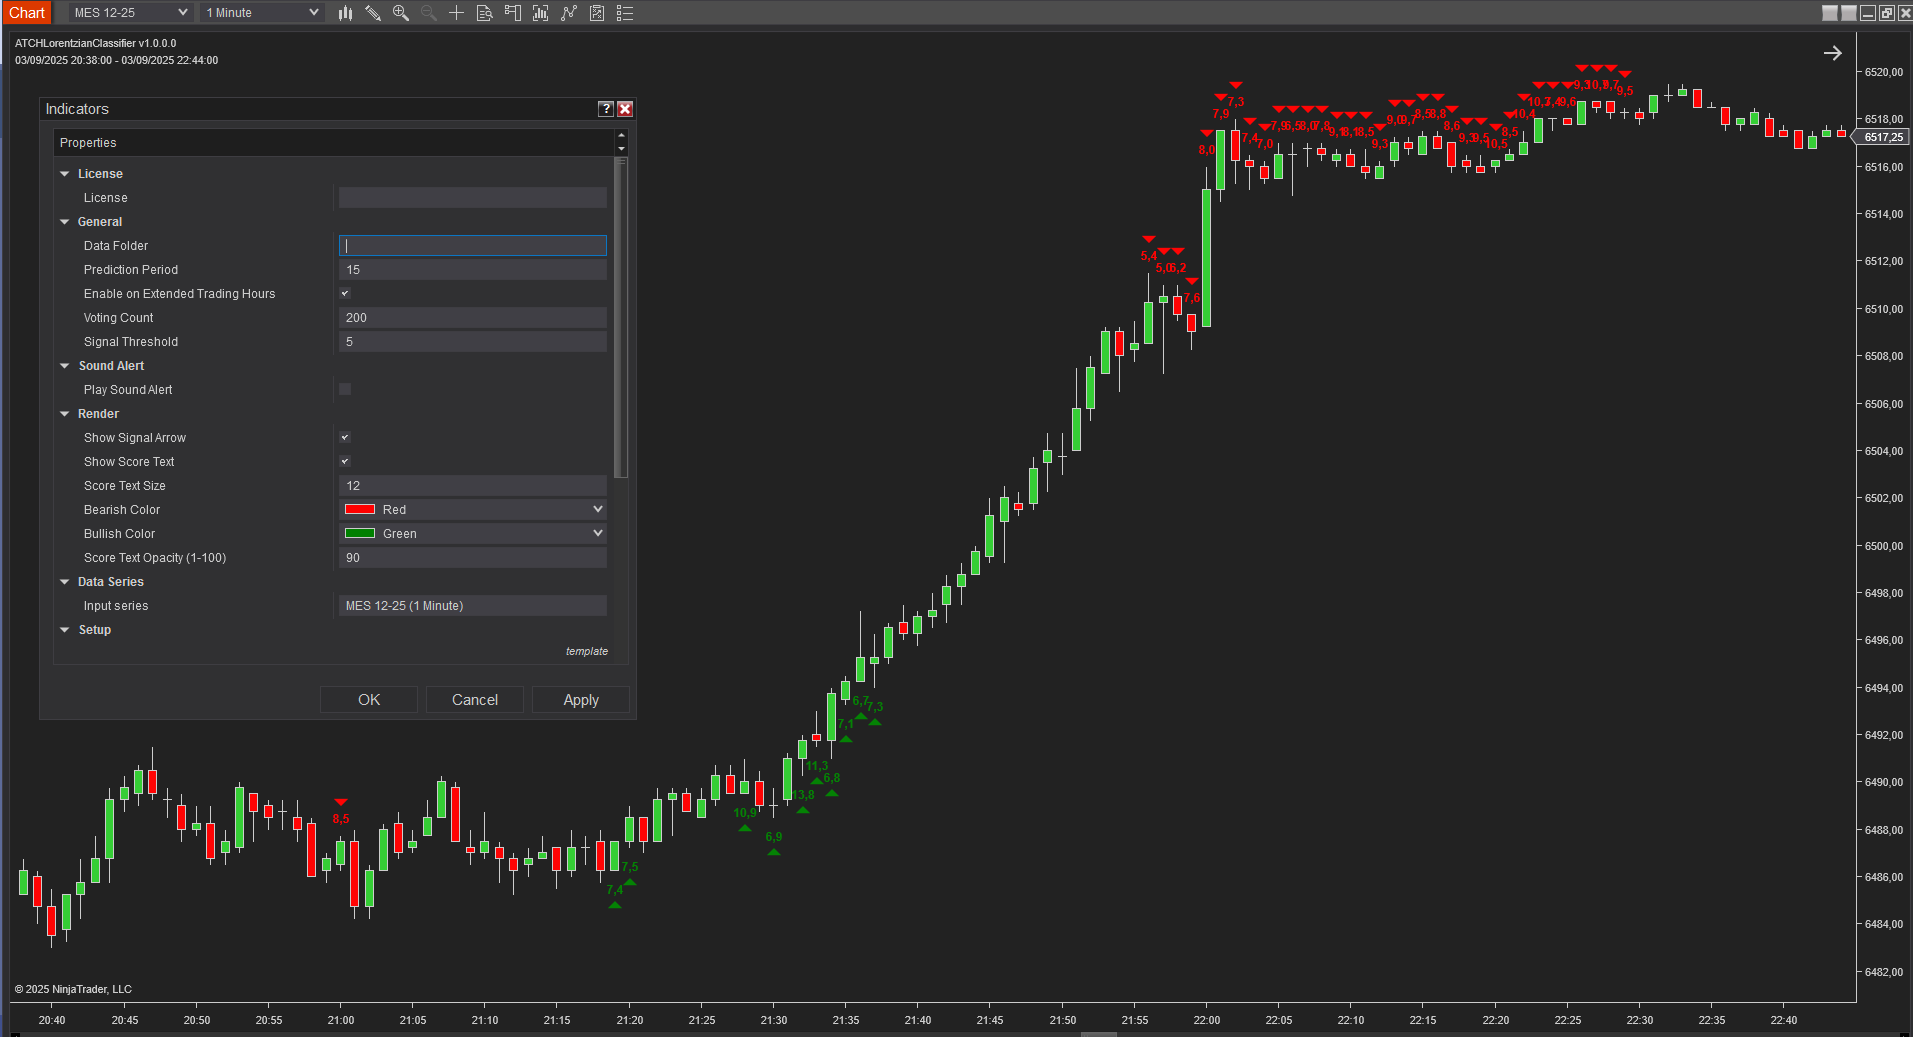
The indicator can produce a more complexe signal which is a sequence of two consecutive arrow signals. if the two signals are close to each other and are forming an increasing (bullish) or decreasing (bearish) price action. One can trade these signals as a range breakout entry setup. On the above example on MES, the indicator has detected two consecutive signals with increasing price action and with increasing prediction score. Those signals define a price range which can be traded for breakout as illustrated on the image
Here is another example on the bearish side

Parameters
We always try to keep the parameters to minimum.
| License | |
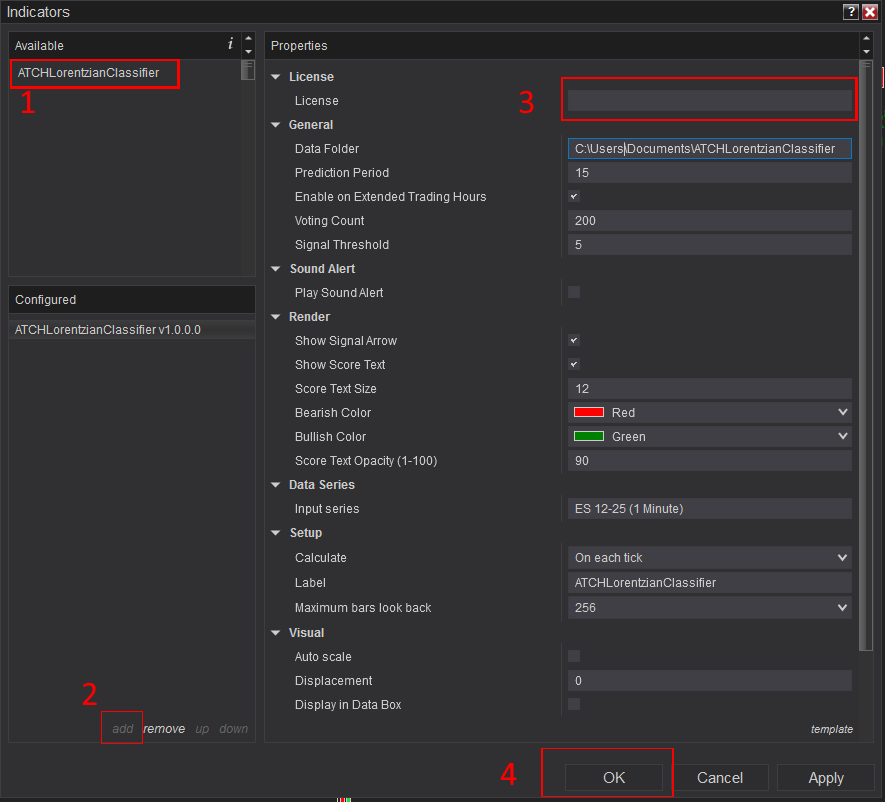
| License | This is the free license key you get when you create an account on automated-trading.ch. After creating an account, copy your license key from the billing page. You need to set this parameter only once per month, once the license key is validated it will be remembered for the rest of the billing cycle. This indicator is totally free to use, but you need to register to have a free account and License to be able to use it. |
| General | |
| Data Folder | This is the path to the folder where you should download and put the training files. You can download them from the installation section below |
| Prediction Period | This parameter sets the number of lookback bars used for inference. The prediction period has a default value of 15, which stands for 15 bars. This can be modified to experiment with other values. |
| Enable on Extended Trading Hours | This parameter enables/disables running prediction on the ETH (extended trading hours) interval 18:00-09:30 EST. This can be useful if you only want to trade during RTH |
| Signal Threshold (Points) | This parameter sets a threshold from 0 to infinite positive numbers that will be the minimum predicted price movement to generate a signal. The more you increase this value the less signals you will obtain. |
| Prediction Candle Shift | |
| Voting Count | This paramter sets the number of samples (similar bar sequence) that will be used to calculate the score of the next bars outcome. This parameter can have a special value which is 0. The value zero will make the indicator automatically decide how many samples to take for voting using a clustering algorithm. The default value of this parameter is 0. If you set the value to another value than 0 for example 20, it means the indicator will always take 20 samples that will vote for an average price movement outcome. |
| Render | |
| Show Signal Arrow | This will enable/disable drawing signal arrow when a signal is generated |
| Show Score Text | This will enable/disable drawing signal prediction scrore when a signal is generated |
| Score Text Size | This will set the text font size of the Score Text if it is drawn |
| Draw Opacity (1-100) | This will set the opacity of the different drawing by the indicator |
| Arrow Bullish Color | The color to draw bullish arrow signals |
| Arrow Bearish Color | The color to draw bearish arrow signals |
| Show Sequence Signal | Show the composite signal of two consecutive arrow signals as a range rectangle |
| Sequence Rectangle Bullish Color | The color to draw bullish range rectangles |
| Sequence Rectangle Bearish Color | The color to draw bearish range rectangles |
| Sound Alert | |
| Play Sound Alert | Enable/Disable playing a sound when a signal is generated |
| Play Sound File | This parameter will set the file name to be played on sound alert. This can be set to any .wav file on your computer |
Download & Installation Instructions
Step 1 : Downloading training data files
- Download those .zip Files into any folder. By preference to C:\Users\{Your Windows Username}\Documents\ATCHLorentzianClassifier
- This folder should be set into the Data Folder parameter on the indicator later on
- Don't Extract these files
Step 2 : Ninjatrader Indicator
- Click on the below download button to download the ATCHLorentzianClassifier file
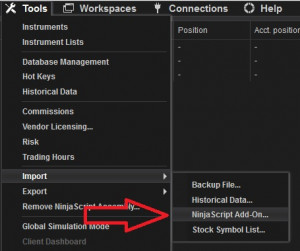
- Import the downloaded .zip file into NinjaTrader using the import NinjaScript menu item
- Next, open a new chart window
- After installing the indicator and opening a new Chart window you should add the indicator to the chart. Right-click on the chart and click on Indicators...
- While adding the indicator you should copy/paste your Free License that you can find on the Billing page
- After that, the indicator is added with success and will execute on Historical Data and then will continue to run on live market data
Frequantly Asked Questions
General
Yes, If you have an idea that you believe can improve this indicator, I will be more then happy to hear from you. Please use the contact page to send me a message
No, the source code of the indicator is protected for copyright reasons
No, this indicator only do rendering and doesn't provide data that can be used from within a strategy.
Yes it is recommended to use this indicator without TickReplay
Release Notes
- Added New composite signal : sequence signal
- Added New parameter : Prediction Candle Shift
- Change of prediction algorithm
- Updated Training Data to 30 January 2025
- Fixed Bug : Indicator didn't work on Real time prices
- Better prediction results with improved prediction algorithm
- Showing of indicator progress on Ninjascript output window
- First Release of the indicator
User Comments & Feedback
You can find feedback of our users and ask questions about this strategy by joining our discord community by following this invite link or clicking on the Discord logo image. Joining is completely free
![]()