

ICT Concepts Indicator
 Created 27 Apr 2025
·
Updated 11 Oct 2026
Created 27 Apr 2025
·
Updated 11 Oct 2026
The ICT Concepts indicator is a Premium indicator for the Quantower platform, displaying key concepts of the ICT (Inner Circle Trader) trading methodology and style.
Prerequisites
To use this indicator you should have the following prerequisites available.
- Quantower trading platform, at least version v1.141.19. Click here to download the platform.
- A free Quantower license.
- An automated-trading.ch account with an active Premium Subscription
Description
The ICT Concepts Quantower indicator displays the key concepts of the ICT trading methodology and style:
- Change of Character (or Market Structure Shift), indicating that the trend might change
- Break of Structure (or Market Structure Break), indicating a continuation of the trend
- Fair Value Gaps, representing displacements of price — instances of inefficiencies/imbalances visualized by three consecutive candles containing one large middle candle whose bordering candles' upper and lower wicks don't overlap
- Order Blocks, representing crucial support and resistance levels derived from aggressive price movement, usable as entry or exit levels
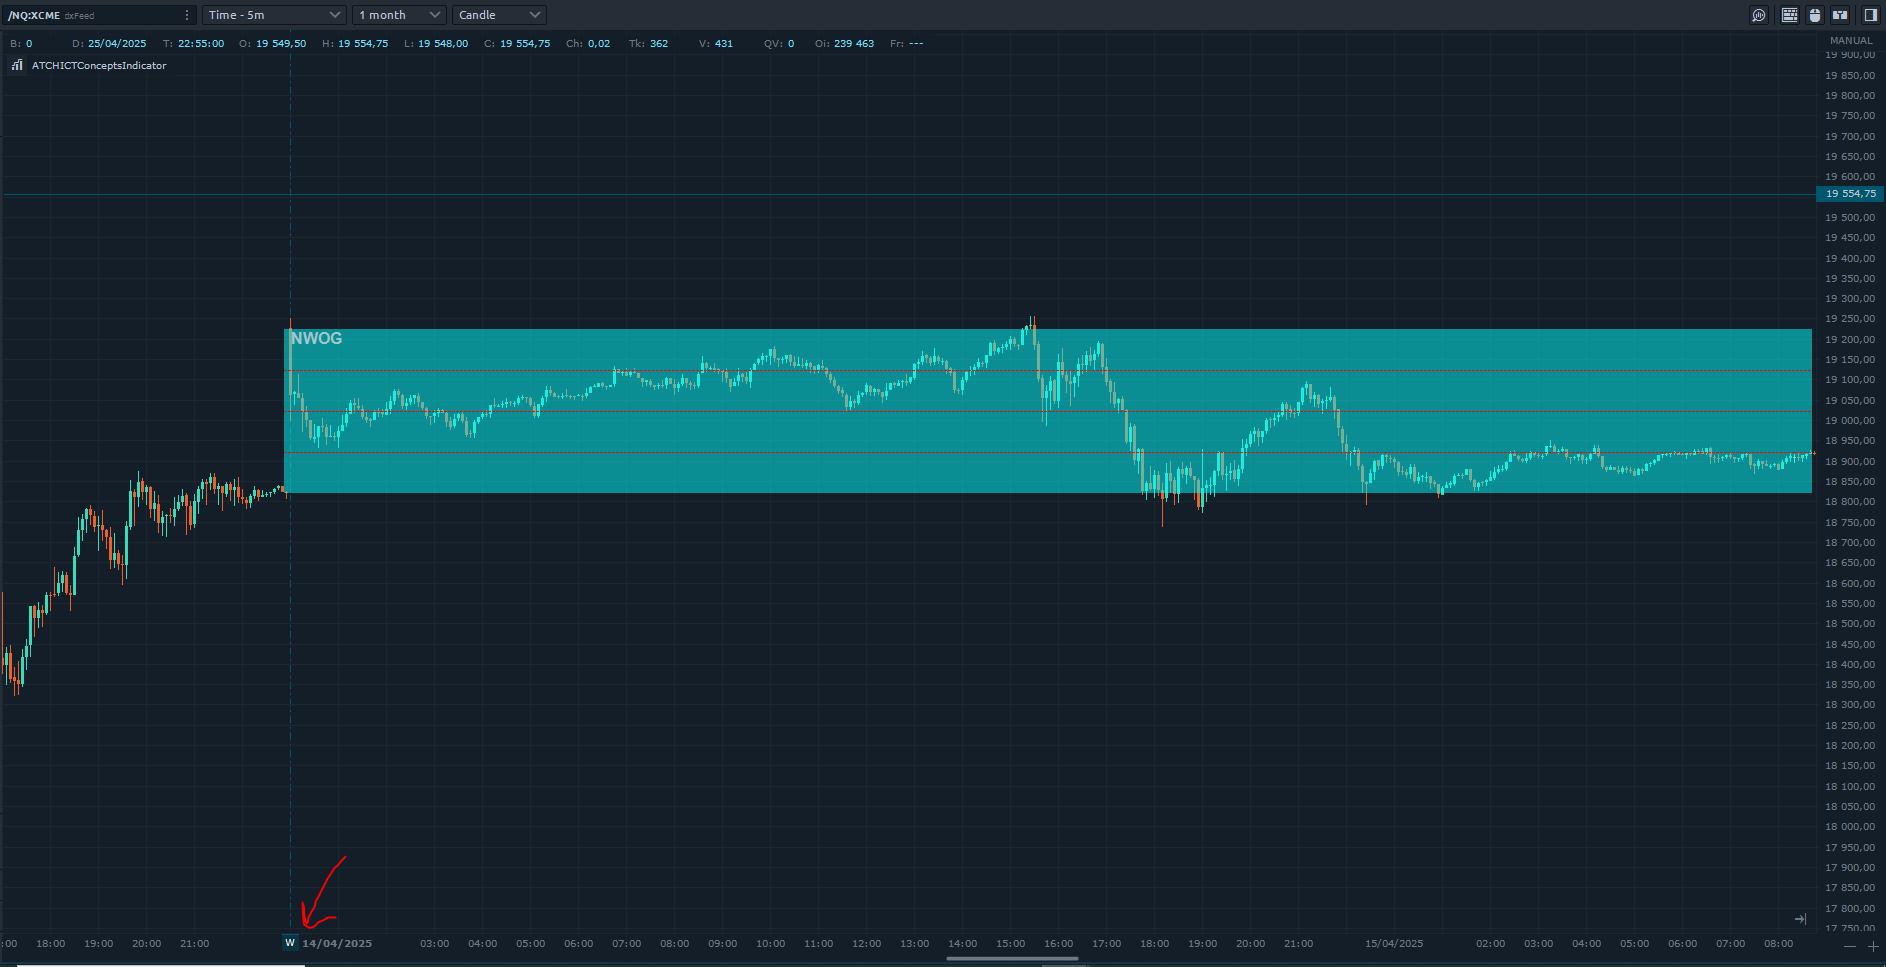
- NWOG (New Week Opening Gap) — the price gap between Friday's closing price and Sunday's opening price
- NDOG (New Day Opening Gap) — the price gap between yesterday's closing price and today's opening price
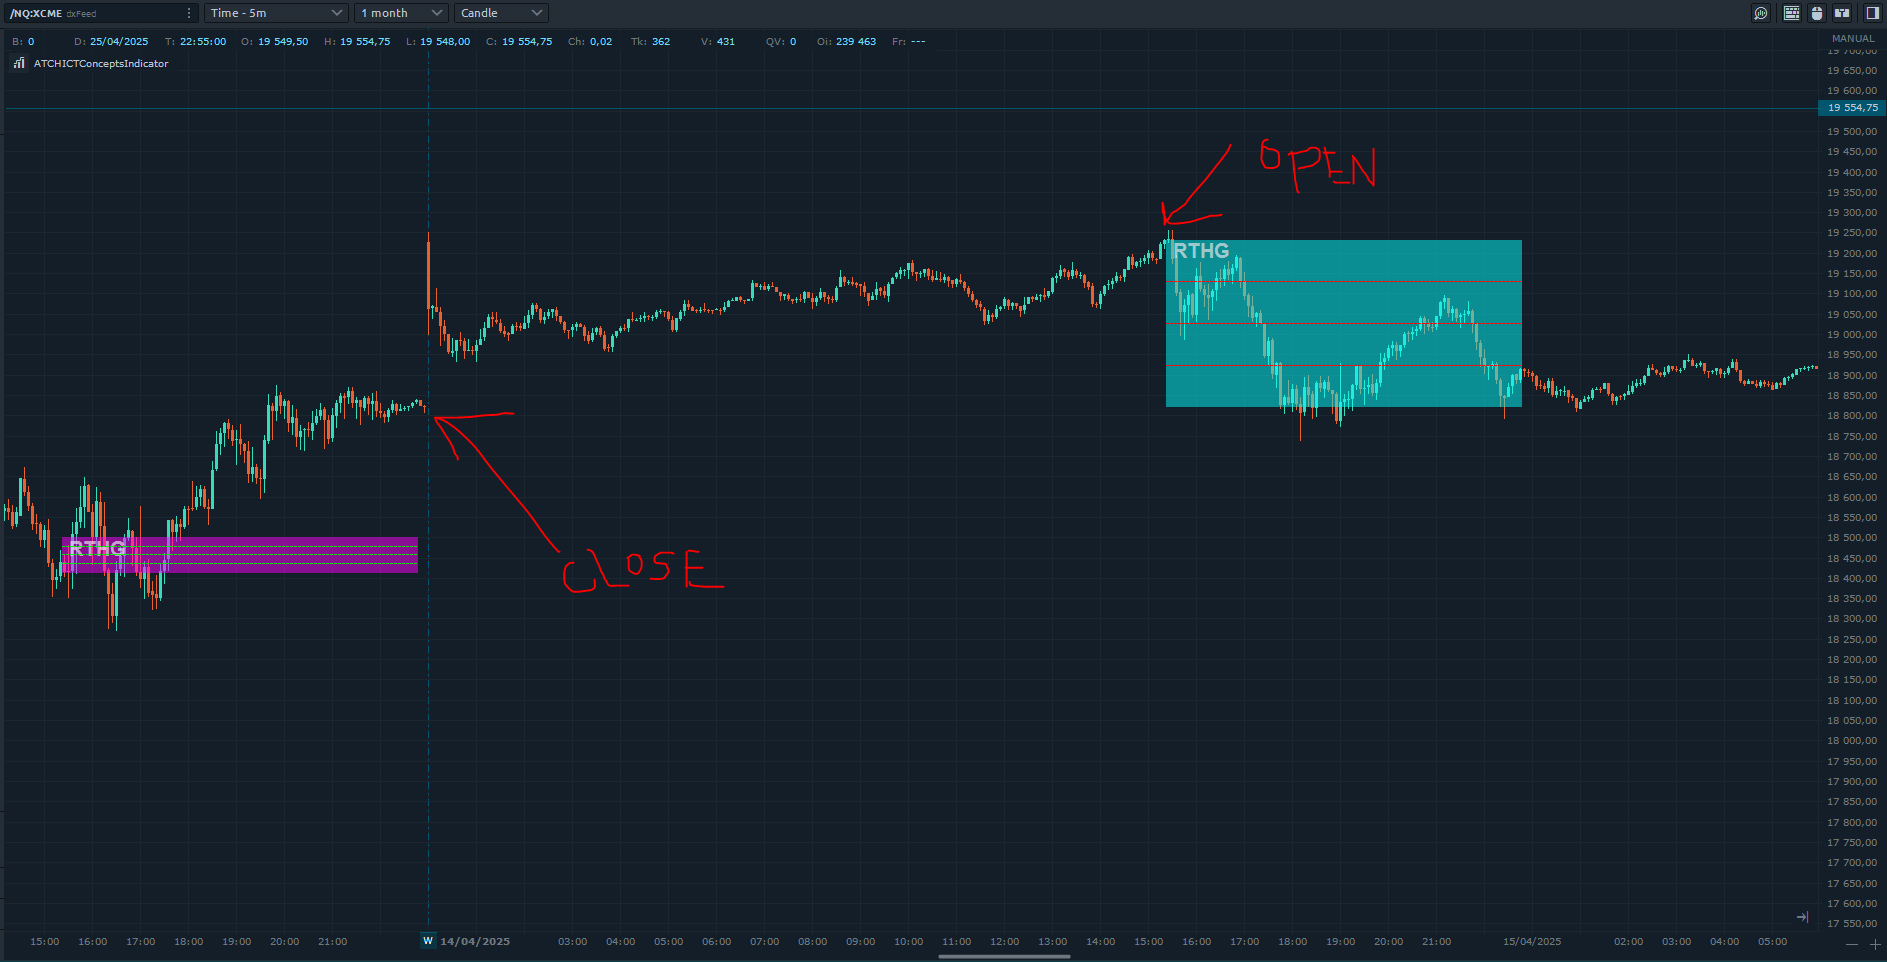
- RTHG (Opening Range Gap) — the distance between a session's first opening tick and the previous session's close
Examples
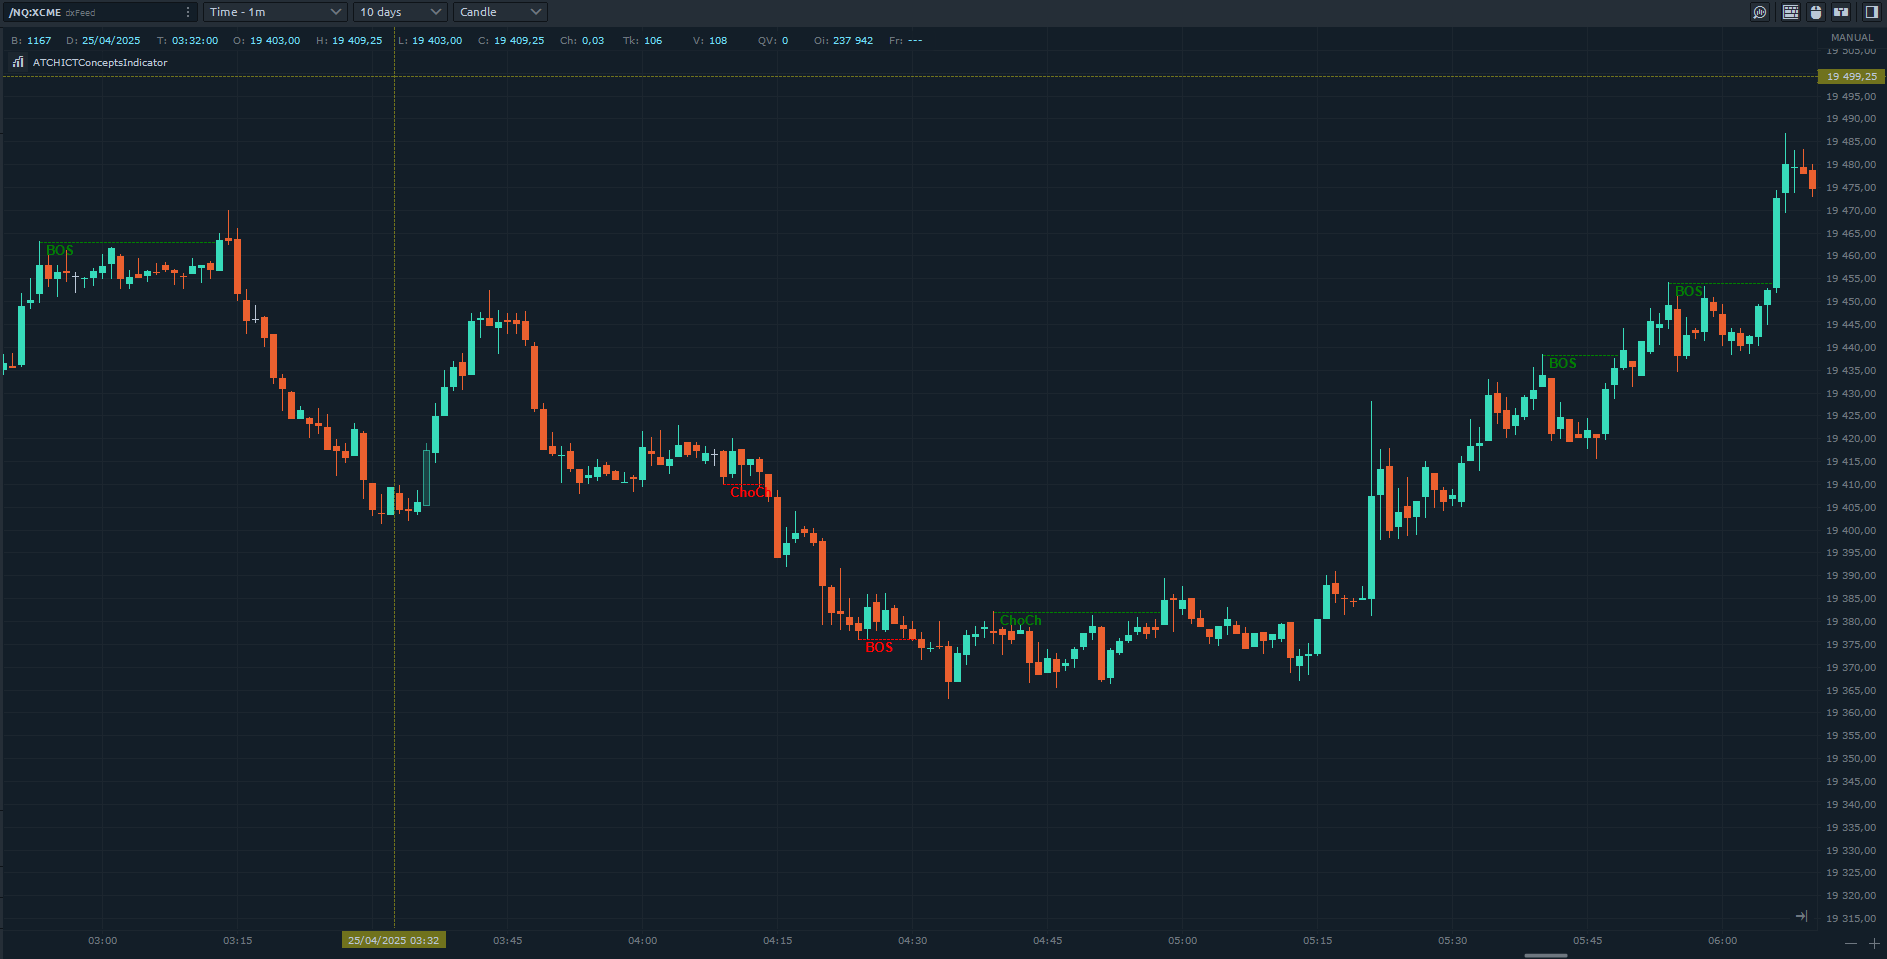
Change of Character (Market Structure Shift) and Break of Structure
The market structure features of the indicator draw market structure shifts and breaks of structure. Market structure shifts are price breakouts indicating a probability of price changing direction; breaks of structure are price breakouts indicating a trend-direction continuation. Both are building blocks of the ICT methodology and can be used as bias determinants and filters to go long or short.
Fair Value Gaps
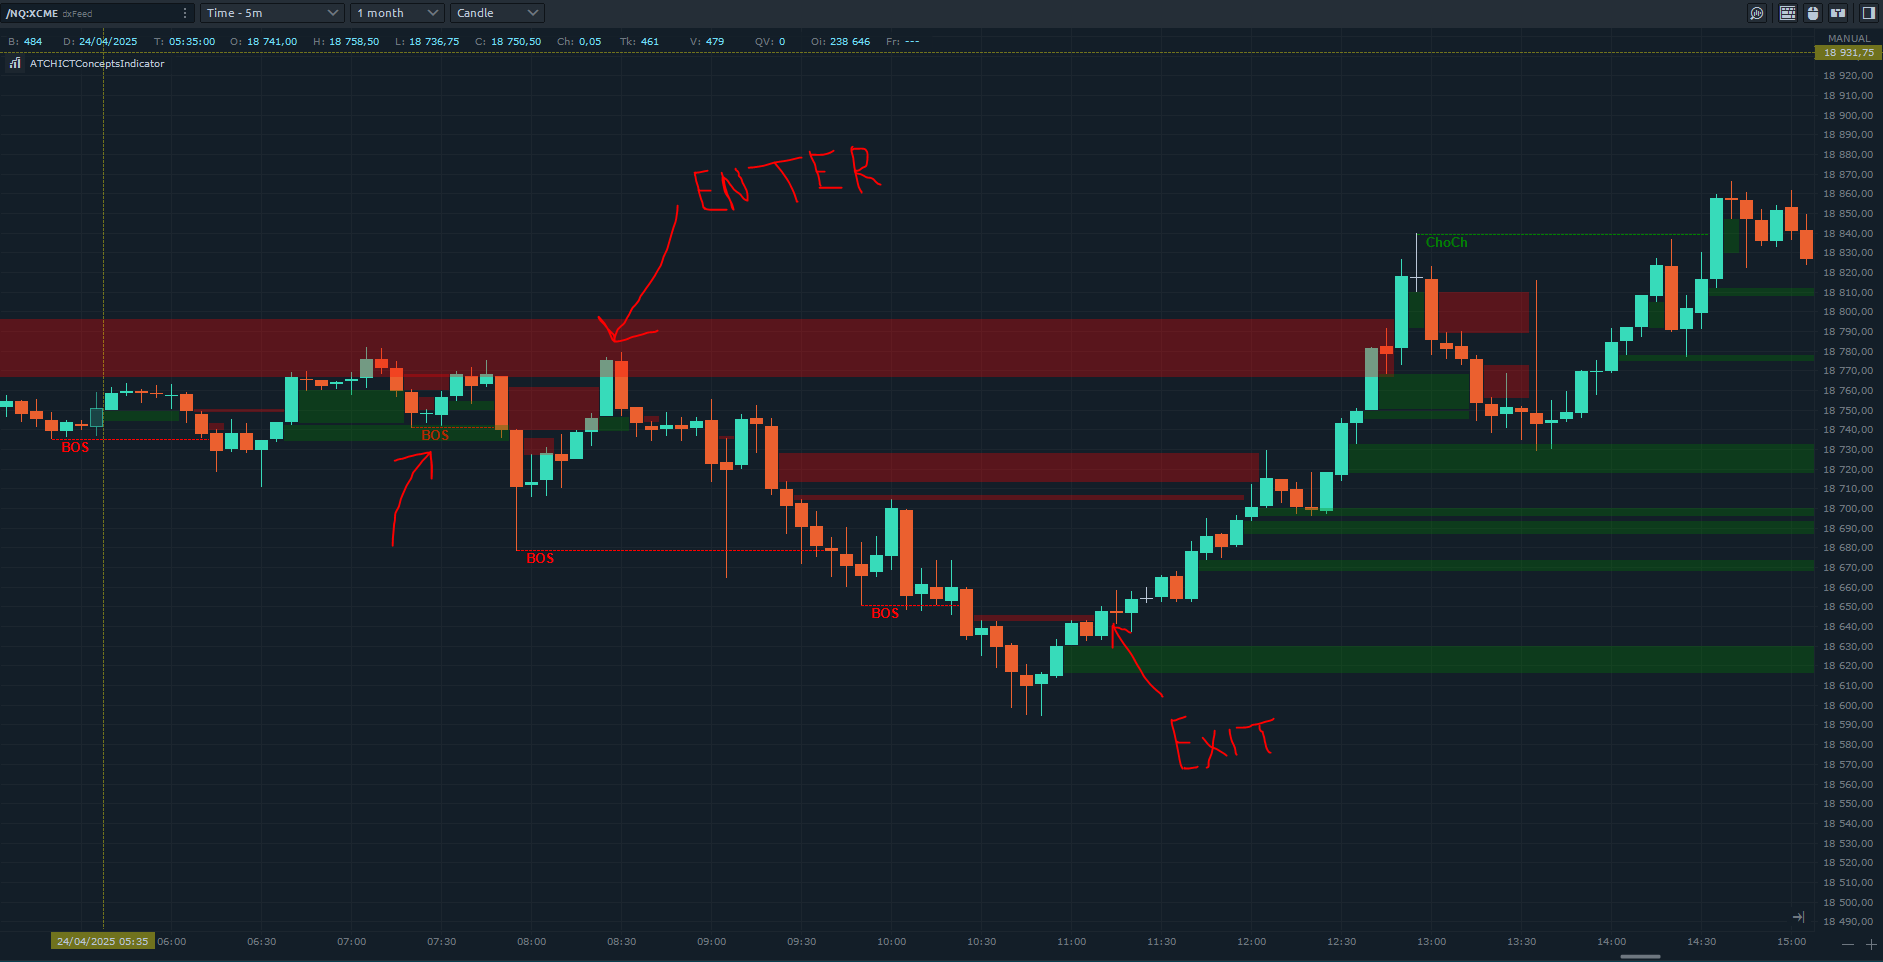
Coupled with MSS and MSB, Fair Value Gaps can be a very good signal to enter a trade. Bullish FVGs are drawn in green, bearish FVGs in red — their drawing stops once they're mitigated. One example entry setup: after a bearish Break of Structure has been detected, a clear rejection of price from a bearish FVG is a strong signal to enter short. FVGs can also be used as an exit signal — an inverse FVG (iFVG, an FVG that gets broken on the inverse of its direction) is a strong signal to exit the trade.
Order Blocks
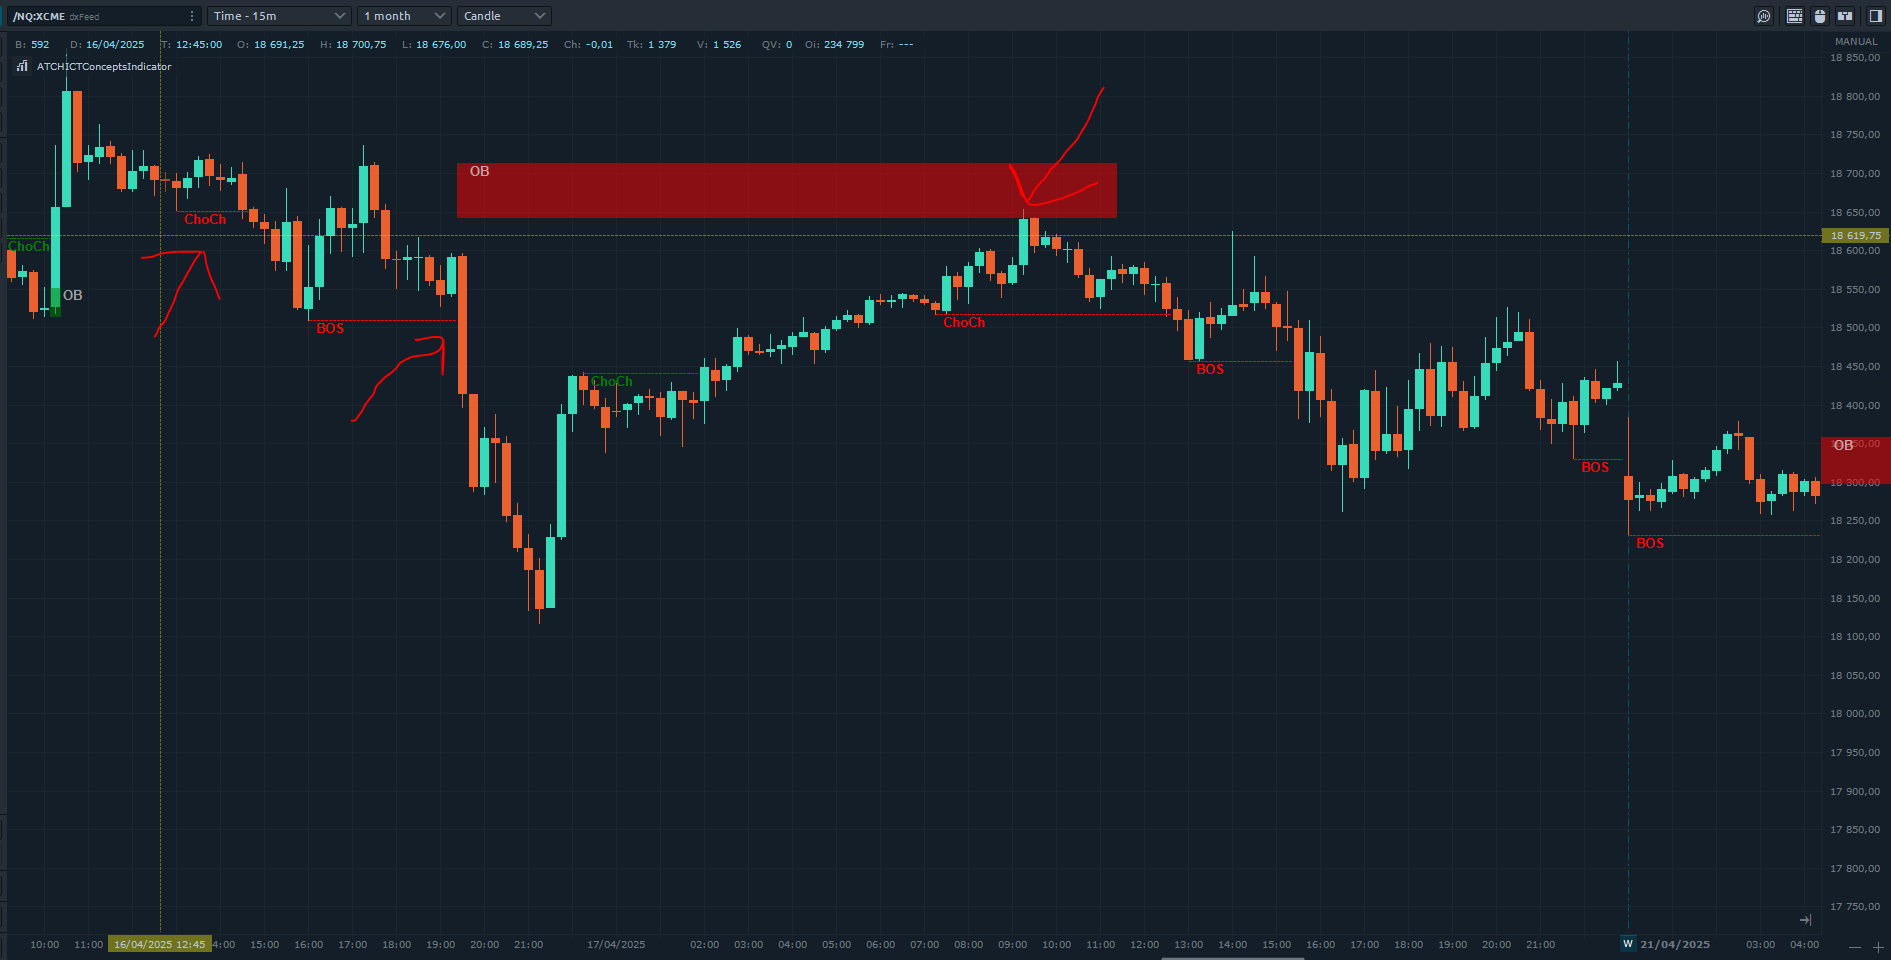
Order Blocks are zones created from the last high swing candle (for bearish) or the last low swing candle (for bullish) before a Market Structure Shift or Break of Structure, with additional rules: the candle defining the Order Block should be followed by an FVG, and the Order Block zone should not be mitigated before the breakout that creates the market structure event (this last rule can be enabled/disabled as a parameter). For example, a bearish Change of Character followed by a bearish Break of Structure creates a bearish Order Block; if price later retraces upward into revisiting the Order Block and gets rejected from it, that's a strong bearish signal that can generate a short trade.
NDOG (New Day Opening Gap)
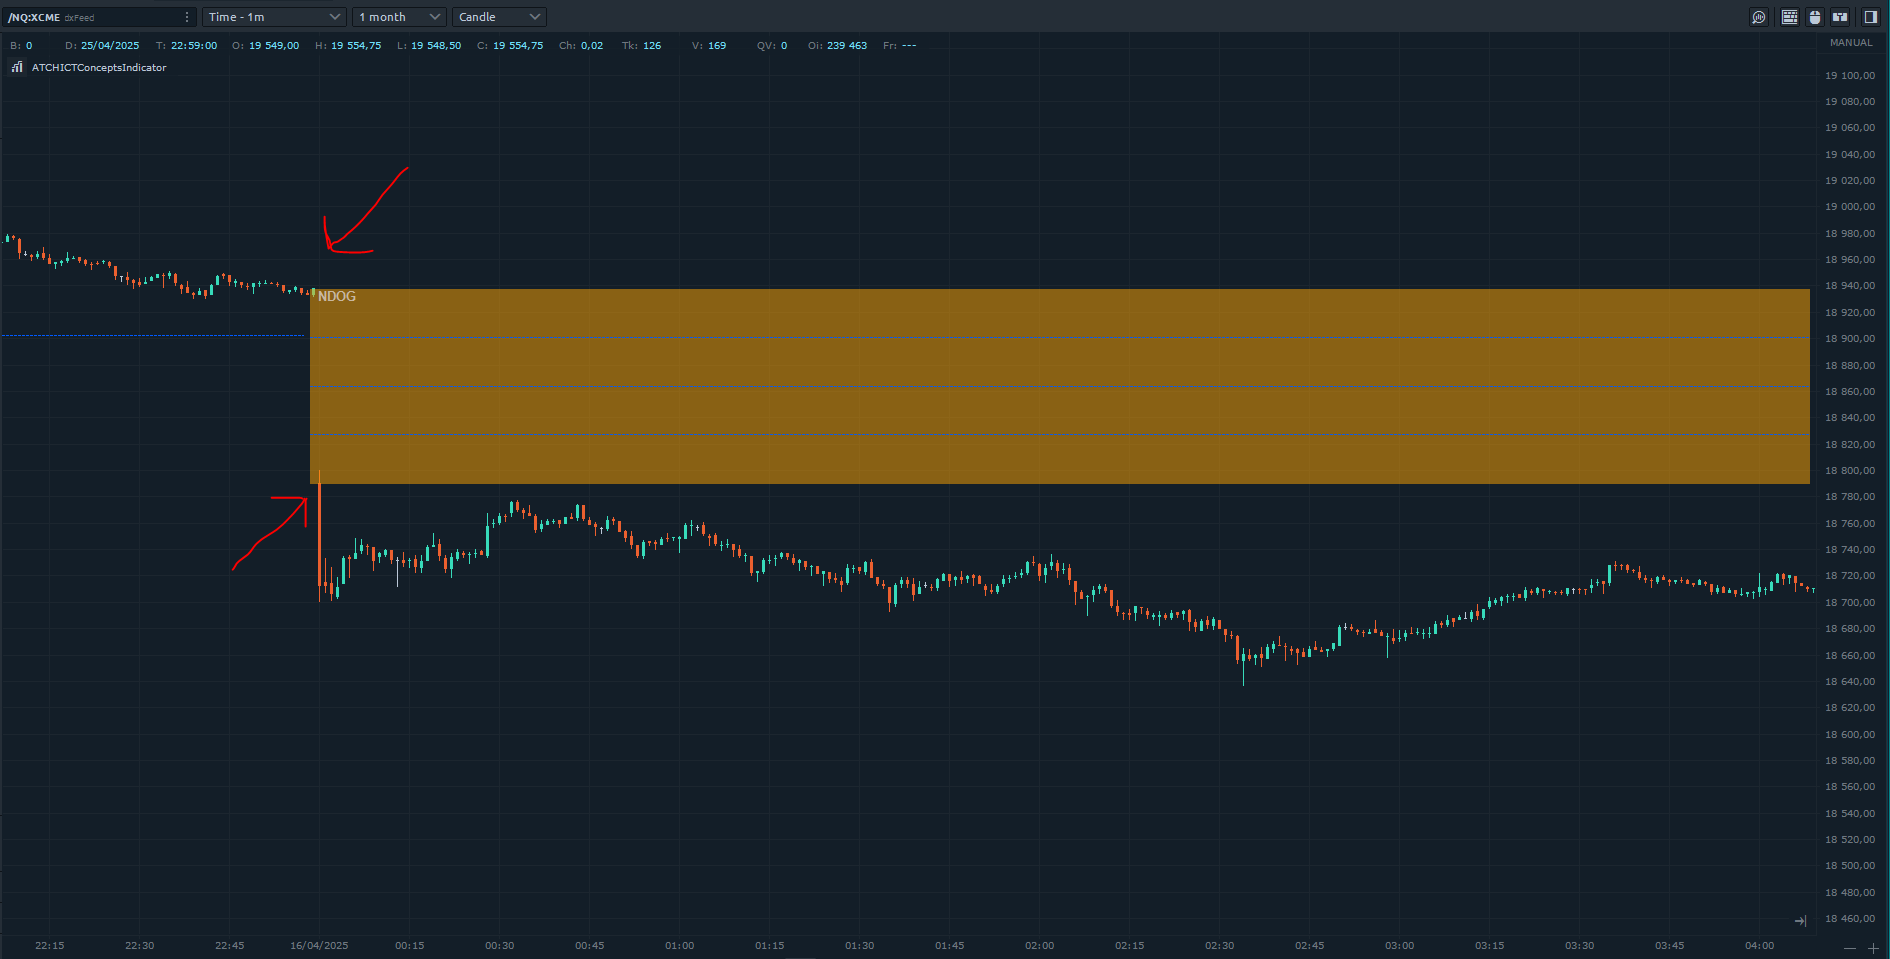
The New Day Opening Gap is defined by ICT as the separation in time/price caused by the 1-hour break that occurs each day in the futures market — the opening price of the gap is the very first tick at the 6:00pm (UTC-4) restart, compared against the 5:00pm closing price of the previous session. These gaps can be drawn on for liquidity as well as general reference points to determine daily bias.
NWOG (New Week Opening Gap)
The NWOG is the gap between Friday's closing price and Sunday's opening price — usable as a liquidity reference and a general reference point to determine weekly bias.
RTH Gap (Opening Range Gap)
The Opening Range Gap, also known as the Regular Trading Hours (RTH) Gap, is the distance between the first opening tick of a session and the previous session's close, when looking at a chart's Regular Trading Hours (not to be confused with Electronic Trading Hours). This gap is an important element for futures market traders following the ICT methodology — specifically, the Opening Range Gap occurs between 4:15pm (UTC-4) and 9:30am the next day.
Features
The ICT Concepts indicator has a set of unique features:
- Can play a sound alert on each ICT zone (FVG, Order Blocks, ChoCh, BoS)
- Can be run on any time-based or price-based chart
- Active development, constantly adding new features
Parameters
We always try to keep the parameters to a minimum.
| License | |
| License | The license key you get when you create an account on automated-trading.ch. After creating an account, copy your license key from the billing page. You need to set this parameter only once — once validated, it will be remembered. |
| Fair Value Gaps | |
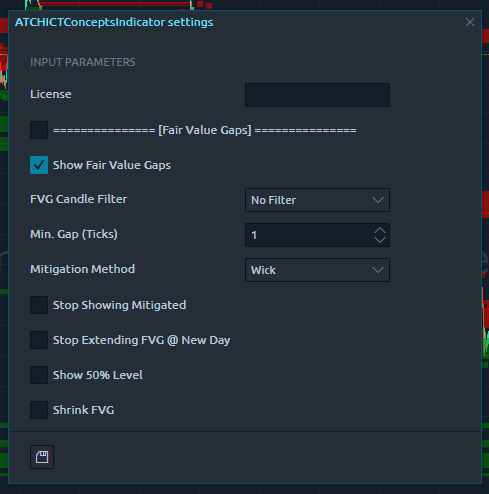
| Show Fair Value Gaps | Enables/disables drawing of Fair Value Gaps. |
| FVG Candle Filter |
Sets a filter for FVG detection.
|
| Min. Gap (ticks) | Minimum distance, in ticks, between the FVG's wicks for it to be valid. Increasing this value detects fewer FVGs; decreasing it detects more. |
| Mitigation Method |
When price hits an FVG after its formation, it's said to be "mitigated" and stops extending further. This parameter chooses the mitigation method:
|
| Stop Showing Mitigated | Hides FVG drawing once mitigated, for a cleaner chart. |
| Stop Extending FVG @ New Day | Stops FVG zone drawing from extending into a new day. |
| Show 50% Level | Draws the consequent encroachment (50%) level on the FVG zone. |
| Bullish Color / Bearish Color | Brush colors to draw bullish/bearish FVGs. |
| FVG Render Opacity (1-100) | Brush opacity to draw FVGs. |
| Show FVG Label | Enables/disables showing a label on each FVG. |
| The following are used only when Show FVG Label is enabled. | |
| FVG Label Size / Color / Opacity (1-100) | Text size, color, and opacity of the FVG label. |
| Play Sound when FVG is created/mitigated | Enables playing an alert sound when an FVG is created or mitigated (useful if you want to trade FVG pullbacks). |
| Play Sound File FVG | Sets the file name to be played on FVG sound alert — any .wav file on your computer. |
| Market Structure | |
| Swing Period | Swings are higher lows, higher highs, lower highs and lower lows. After each price bar closes, a swing can be detected, but the next bar (or the one after) can cancel it by creating a new swing of the same type. The swing period sets how many bars are enough to separate two swings of the same type. |
| Show Price Swings | Enables/disables drawing a mark below/above swing price points — useful to see how market structure is analyzed, since those swing points are the building blocks of the indicator's algorithm. |
| Swing Bullish Color / Swing Bearish Color | Color brush of the low/high swing points. |
| Swing Opacity (1-100) | Opacity of the swing points drawing. |
| Show ChoCh (MSS) | Enables/disables drawing of Change of Character (also known as Market Structure Shift). |
| MSS Bullish Color / MSS Bearish Color | Color brush of bullish/bearish MSS. |
| MSS LineStyle | Line style used to draw the MSS line. |
| Show Choch (MSS) Label | Shows a label on each MSS on the chart. |
| Show Break of Structure | Enables/disables drawing of Break of Structures. |
| BOS bullish Color / BOS bearish Color | Color brush of bullish/bearish Break of Structure drawings. |
| BOS LineStyle | Line style used to draw the BOS line. |
| Show BOS Label | Shows a label on each Break of Structure on the chart. |
| Play Sound on MSS or BOS | Enables playing an alert sound when a market structure event (MSS or BOS) occurs. |
| Play Sound File MSS BOS | Sets the file name to be played on sound alert — any .wav file on your computer. |
| Order Block | |
| Show Order Blocks | Enables/disables display of Order Blocks. |
| The following are visible only when Show Order Blocks is enabled. | |
| Stop Extending OB @ New Day | Stops the Order Block zones drawing from extending into a new day. |
| Allow Mitigation Before Validation | An Order Block is normally invalid if price mitigates its zone before its creation — this parameter gives an exception, allowing Order Blocks to be valid regardless. |
| OB Bullish Color / OB Bearish Color | Color brush to draw bullish/bearish Order Blocks. |
| OB Render Opacity (1-100) | Opacity used to draw Order Blocks. |
| Show Order Block Label | Enables/disables showing a label on each Order Block. |
| The following are visible only when Show Order Block Label is enabled. | |
| Order Block Label Size / Color / Opacity (1-100) | Text size, color, and opacity of the Order Block label. |
| Play Sound when OrderBlock is created/mitigated | Enables playing an alert sound when an Order Block is created or mitigated (useful for trading Order Block pullbacks). |
| Play Sound File Order Block | Sets the file name to be played on sound alert — any .wav file on your computer. |
| NDOG / NWOG / RTHG (New Day/Week Opening Gap, Opening Range Gap) | |
| Show NDOG / Show NWOG / Show RTHG | Enables/disables display of each gap zone type. |
| Each of the following sub-groups is visible only when its corresponding Show parameter above is enabled. | |
| Stop Drawing @ New Day / New Week | Stops that gap zone's drawing from extending into a new day/week. Individual zones can also be stopped by clicking on them directly. |
| Show 50% / 75% / 25% Level | Draws the consequent encroachment (50%) or Quadrant (75%/25%) levels on the gap zone. |
| Bullish Color / Bearish Color | Color brush to draw bullish/bearish gap zones. |
| Render Opacity (1-100) | Opacity used to draw the gap zones. |
| Show Label / Label Size / Color / Opacity | Enables and styles the label shown on each gap zone. |
Download & Installation Instructions
License Requirements
At automated-trading.ch you can choose to either purchase a monthly subscription to use our premium products, or use our free products without subscribing.
In both cases, you need to create an account so you can get a License you can use for both premium and free products.
To obtain your license, simply sign up and then get your license on the billing page.
Download
You can also download this strategy — and every other automated-trading.ch strategy or indicator — anytime from your centralized Downloads page.
Installation Steps
Frequently Asked Questions
General
Subscriptions Q&A
Release Notes
- Built with .net 10 to be compatible with latest version of Quantower
- First Release of the indicator