

Random-Forest Machine Learning Indicator for NinjaTrader 8
 Created 05 Apr 2026
·
Updated 12 Apr 2026
Created 05 Apr 2026
·
Updated 12 Apr 2026
This Machine Learning based indicator for NinjaTrader 8 is a Free, powerful predictive tool built on a Random Forest regression algorithm, forecasting future price movements from a sophisticated analysis of multiple market features and technical confluences.
Prerequisites
To properly use this indicator you should have the following prerequisites available.
- NinjaTrader 8, with any license type. Minimum version 8.1.6.*. Click here to download
- Order Flow data is not required to use this indicator (you don't need to have a Lifetime license).
- An automated-trading.ch account with an active Free account (no paid subscription required)
Description
Algorithm Overview
The indicator uses a Random Forest machine learning model, trained on historical market data, to predict price movements a specific number of bars into the future (20 bars on the 1-minute timeframe). Random Forest is an ensemble learning method that combines multiple decision trees to provide robust and accurate predictions — reducing overfitting and improving prediction accuracy by aggregating results from multiple independent models.
Feature Engineering
The Random Forest model analyzes a comprehensive set of features extracted from price action, including:
- Previous Day Reference Points: distance from the previous day's high and low prices, for overnight gap analysis and potential support/resistance levels
- Current Day Reference Points: distance from the current day's high and low prices, capturing intraday momentum and range dynamics
- Higher Timeframe Data: distances from 30-minute and 4-hour timeframe highs and lows, for multi-timeframe signal confirmation
- Technical Indicator Confluence: price proximity to SuperTrend levels and other proprietary indicators, identifying key levels where multiple analyses converge
- Volume Analysis: volume differential compared to the previous bar, capturing changes in market participation and trading intensity
- Price Action Patterns: close price differences over multiple periods, detecting momentum shifts and trend changes
Technology Stack
This indicator is powered by Microsoft's ML.NET library, a professional-grade machine learning framework providing high-performance model training and inference, suitable for real-time trading applications.
Training Data
The model has been trained on extensive historical data capturing various market conditions, volatility levels, and price patterns, so it has learned diverse market behaviors and can adapt to different trading environments.
Prediction Output
The indicator generates predictions as expected price movements (in points) for the next 20 bars. When the predicted movement exceeds the user-defined threshold, a signal is generated — bullish when the model predicts positive price movement, bearish when it predicts a downward move.
Signal Integration & Automation
The entry signals generated by this indicator can be seamlessly integrated with third-party trading software such as AlgoStudio and Bloodhound, letting you automate your trading strategies based on the machine learning predictions — opening up automated order placement and position management.
Audio Notifications
Real-time sound alerts trigger whenever an entry signal is generated, so you never miss an opportunity even when away from your screen — customizable to any .wav file on your computer.
Examples
All the examples below are on the MES instrument, with a prediction threshold of 10 points.
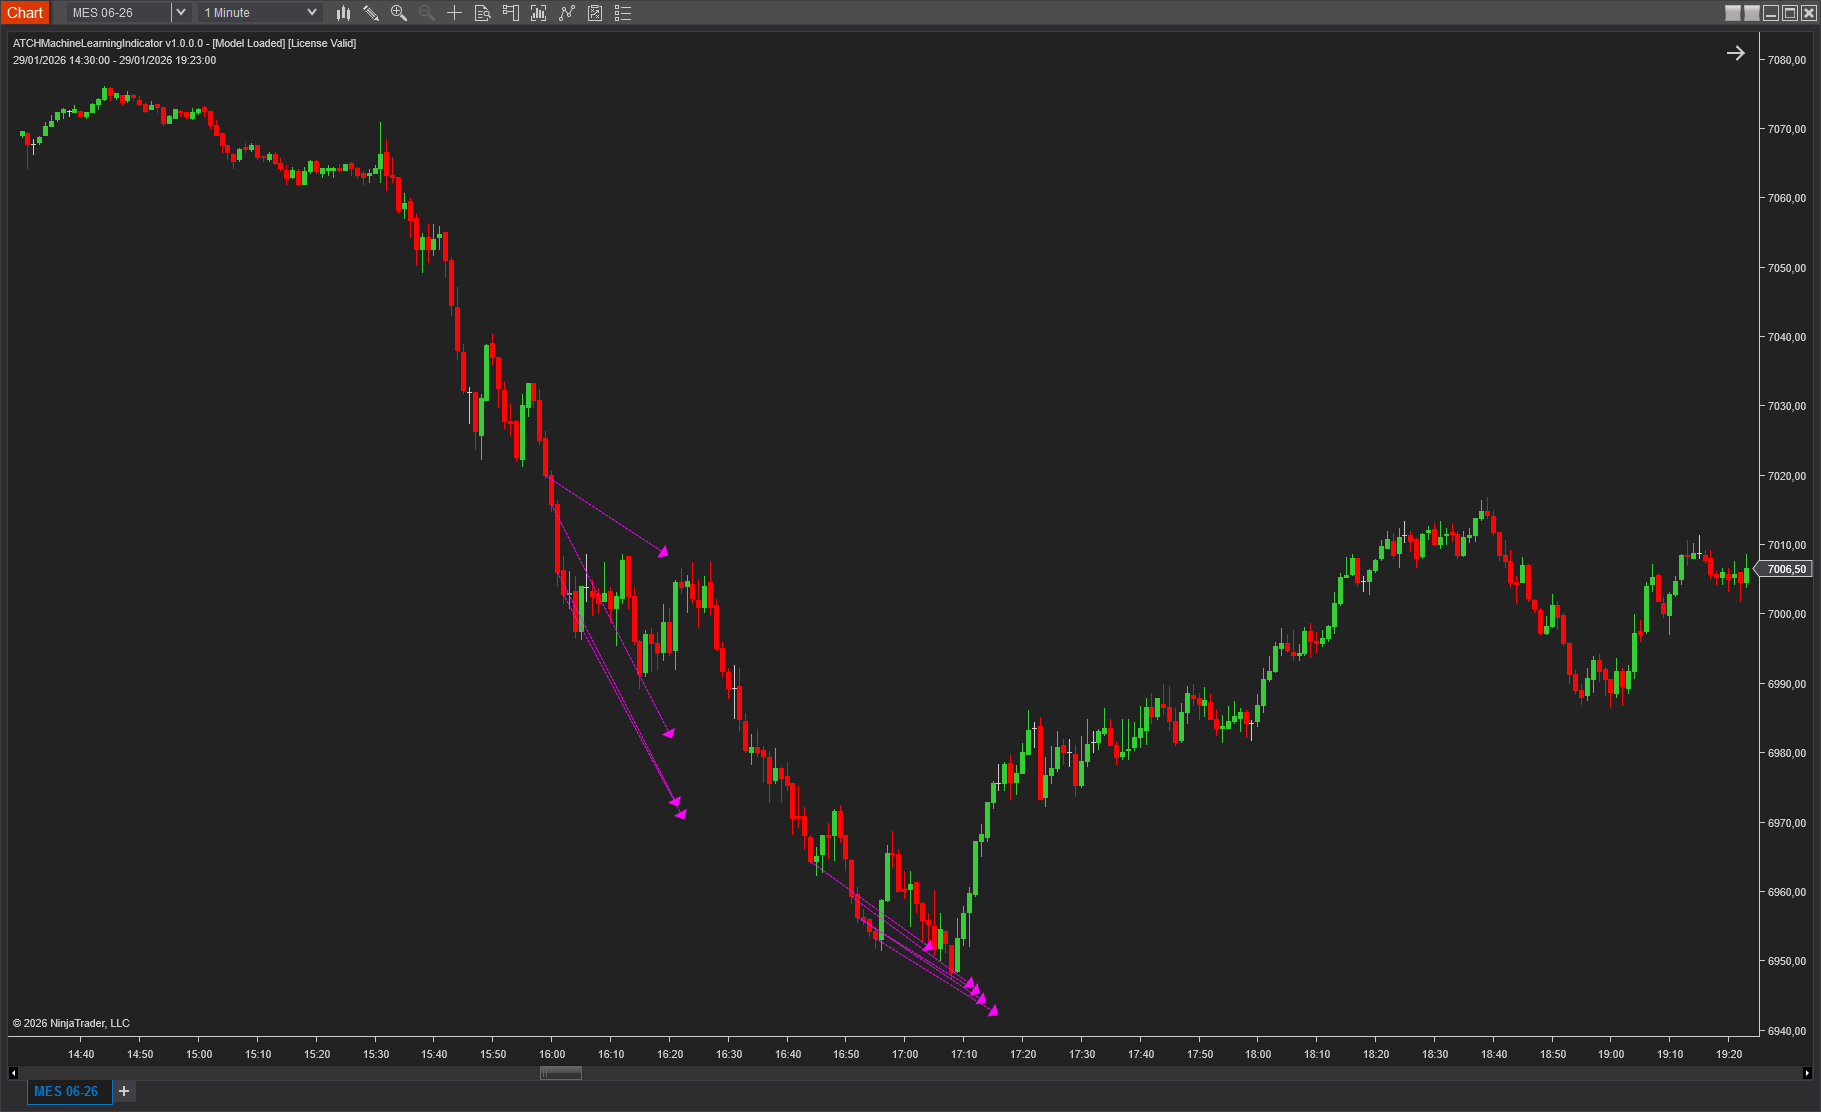
Example 1: Strong Sell Signals on a Bearish Trend
The indicator predicts continuation of a sell trend by generating a series of sell signals, which were confirmed and would have been profitable if taken — generated during RTH (regular trading hours), where volume is considerably high on MES.
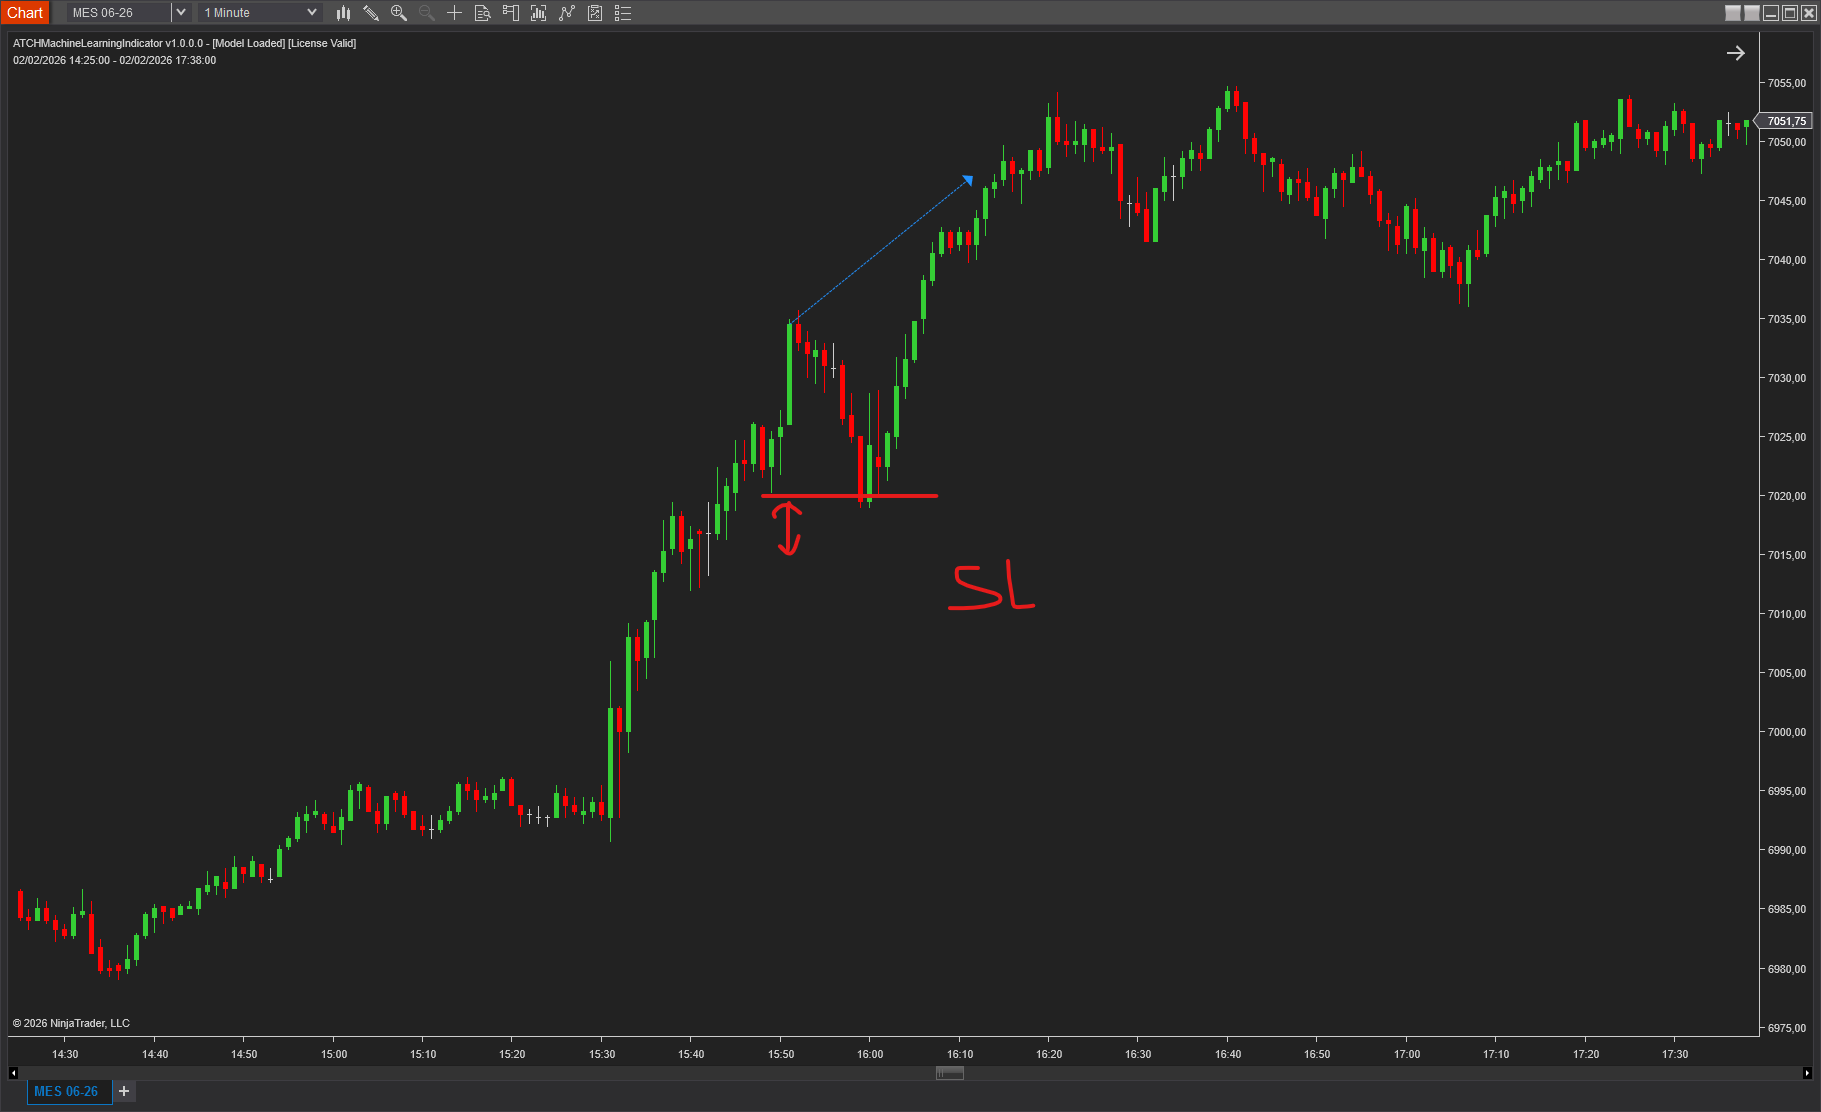
Example 2: Strong Buy Signal, but Where Placing the Stop Loss Is Crucial
A bullish buy signal occurs, but price action later pulls back into the FVG that created the entry signal — a reminder to always add a buffer of points to the FVG wick that created the entry, to avoid getting stopped out by price pullbacks.
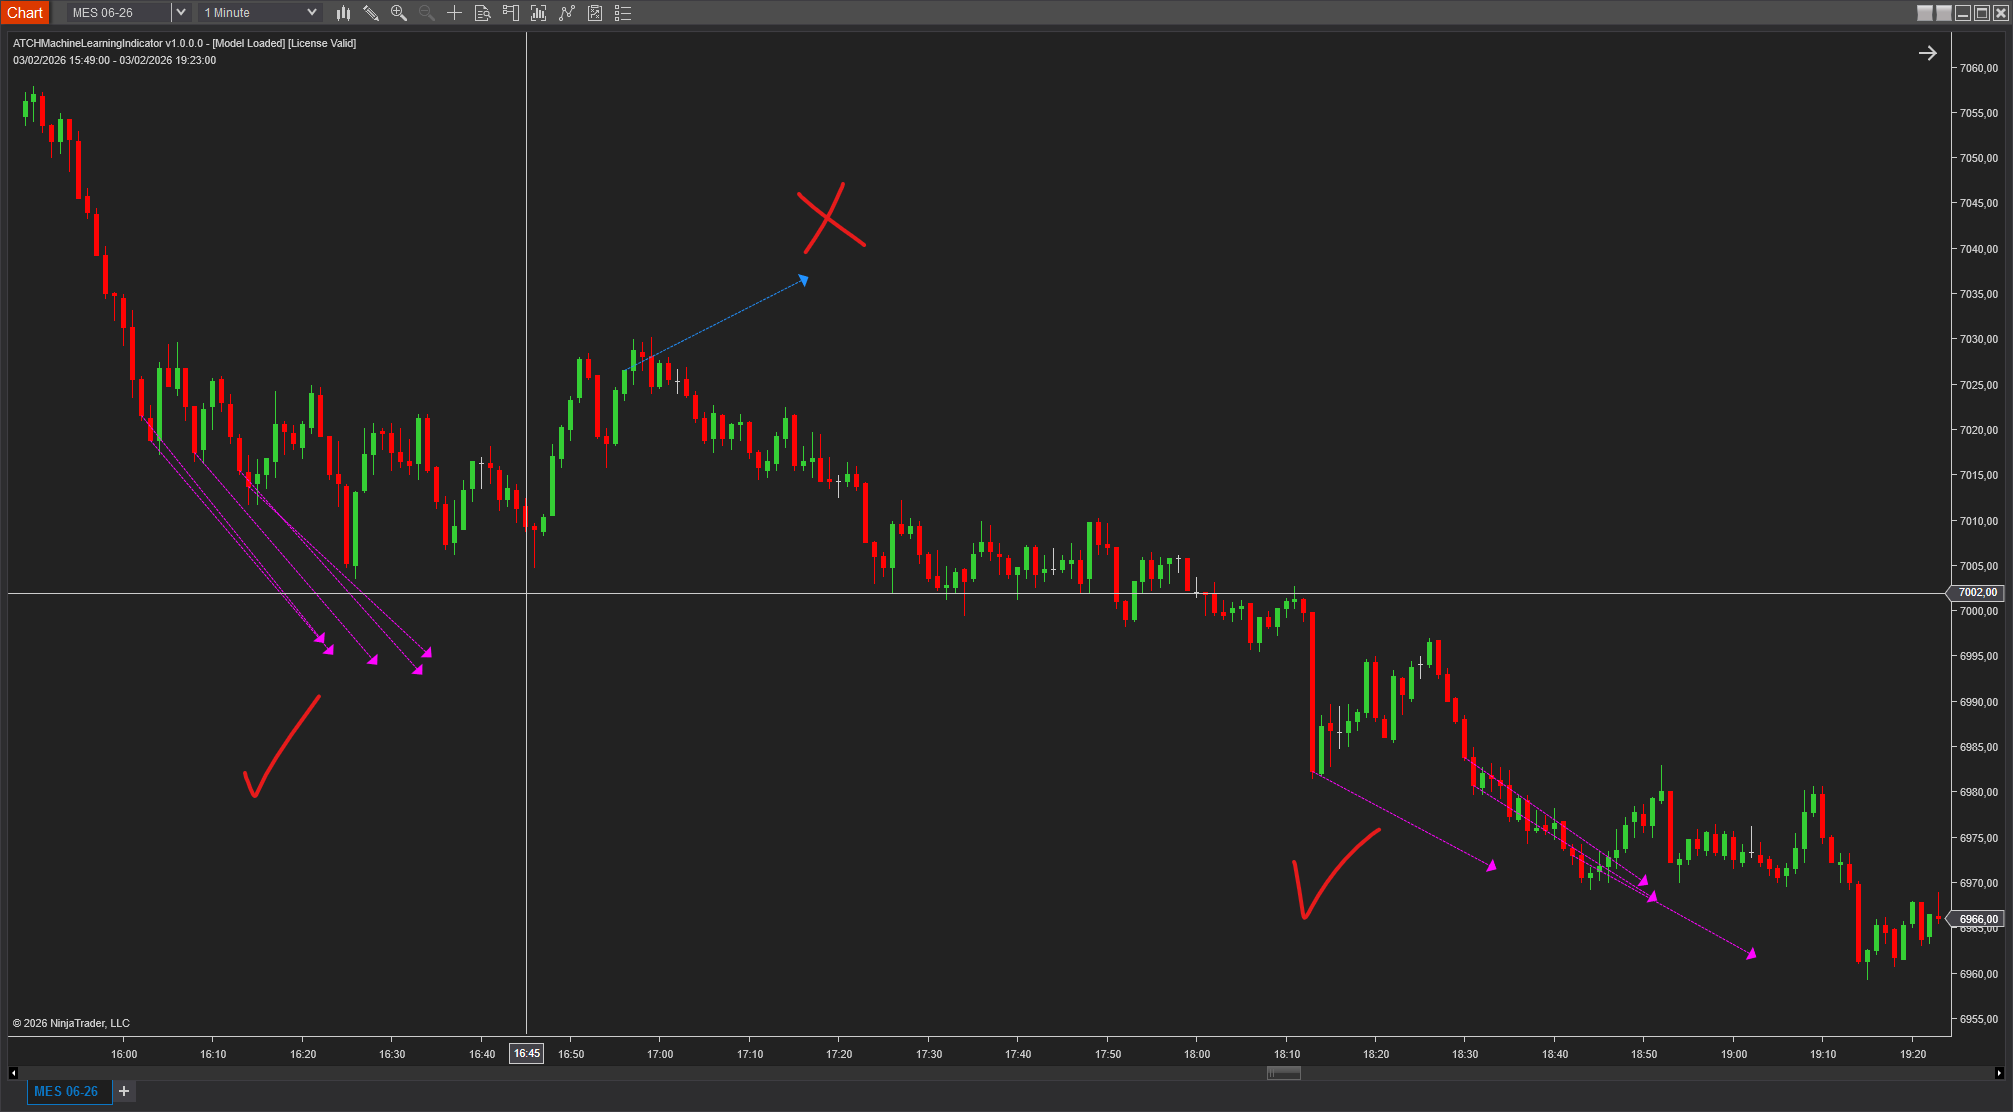
Example 3: Not All Signals Are Perfect, but Previous Signals and Context Matter
The indicator generates a bad bullish signal — but it was preceded by a group of strong bearish signals, and the last group of bearish signals confirms the bearish trend continuation, showing why context around a signal matters.
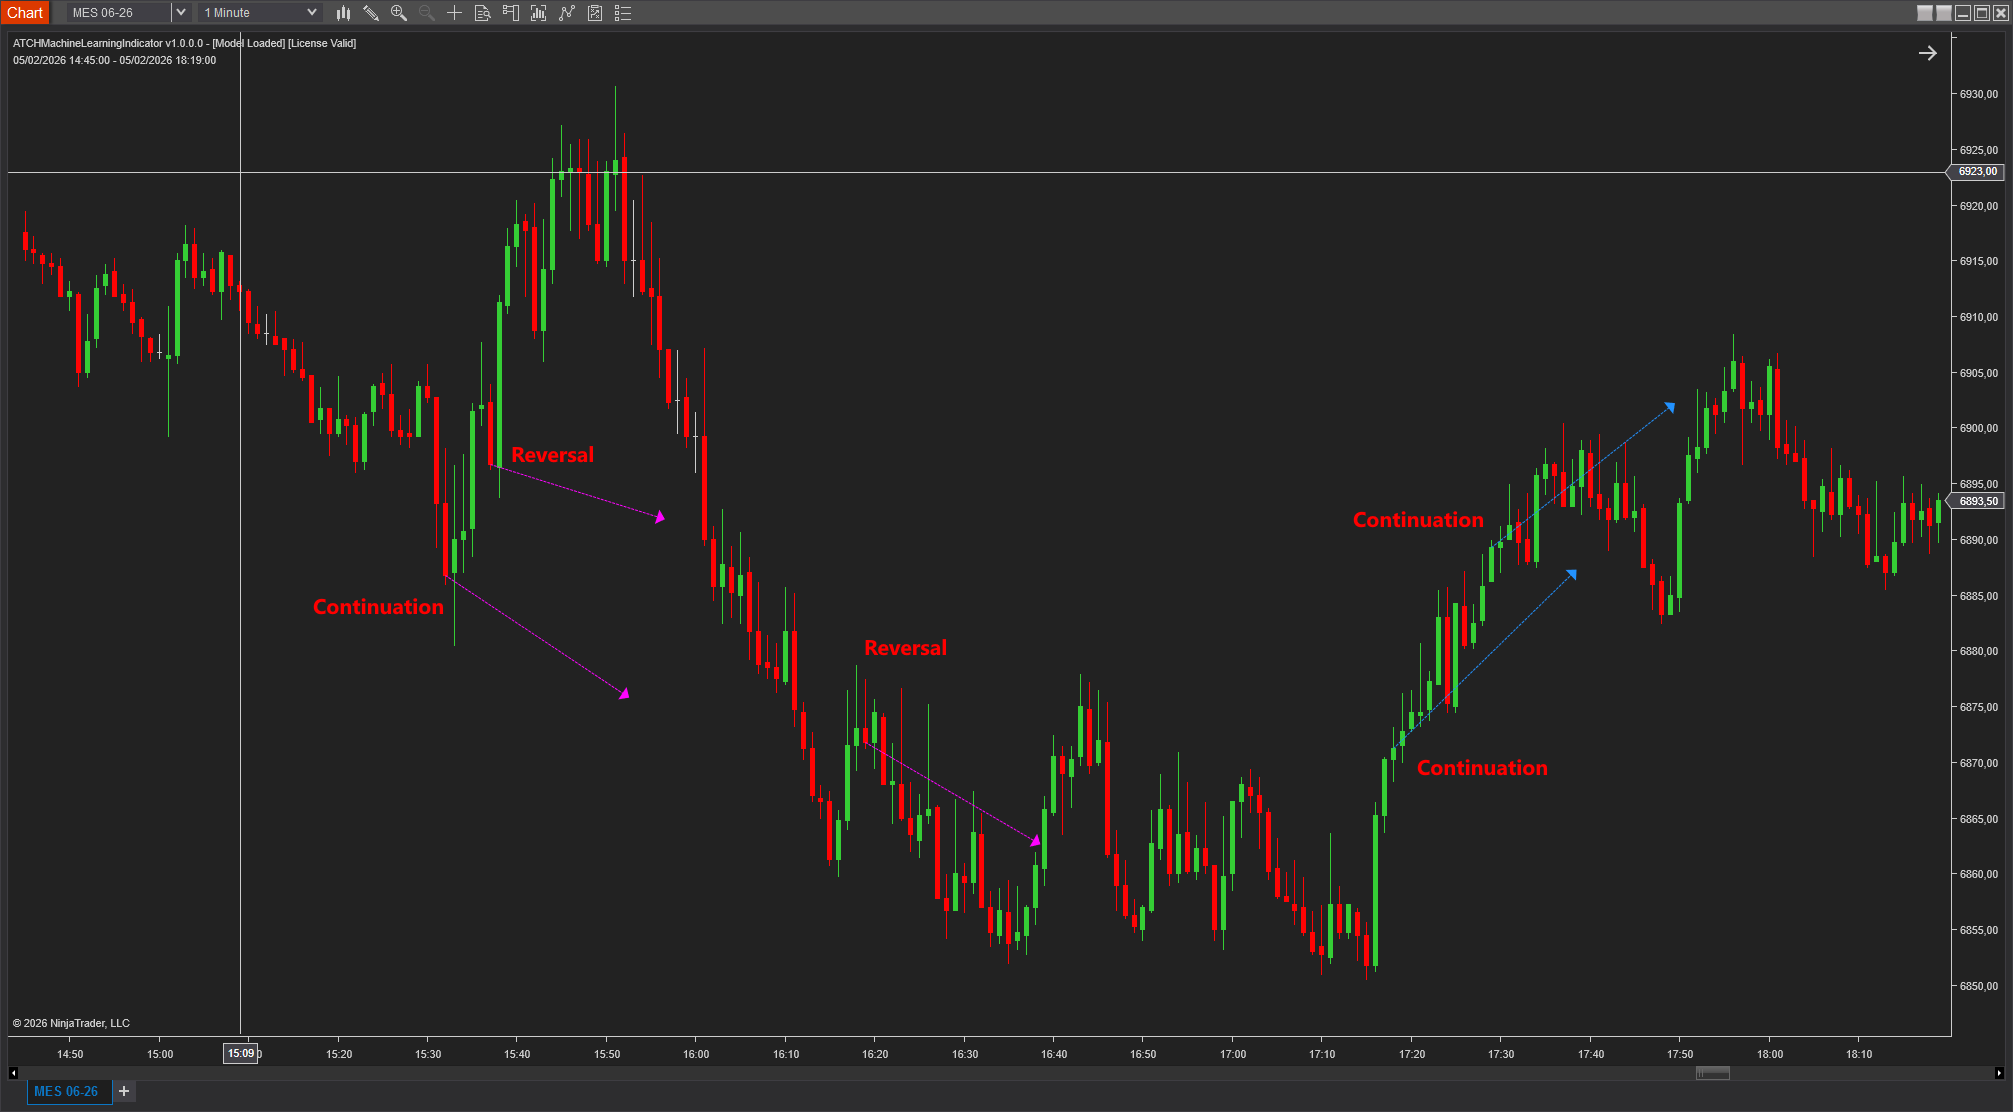
Example 4: Continuation Signals & Reversal Signals
The indicator can generate both reversal and continuation signals. Reversal signals are distinguished by being generated after an opposite-direction FVG — e.g. a bearish reversal signal generated after a bullish FVG followed by a red candle.
Signals & Usage in Strategy Builder
The indicator exposes signal plots that can be used from the Strategy Builder and third-party software such as Bloodhound and AlgoStudio.
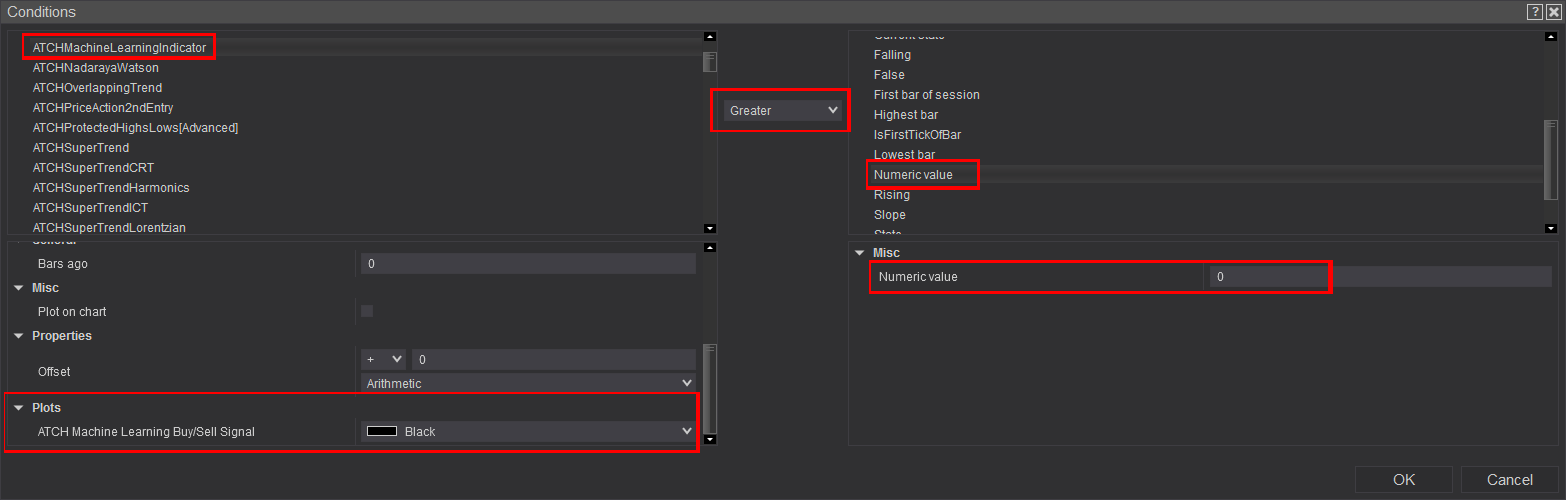
These signal plots are transparent and are not drawn on the chart. To use them from the Strategy Builder, select them and build logic on their values — the Buy signal and Sell signal plots hold +1 for bullish signals and -1 for bearish signals, otherwise 0. So a bullish signal condition should check "greater than 0", and a bearish signal condition should check "lower than 0".
Parameters
We always try to keep the parameters to a minimum.
| License | |
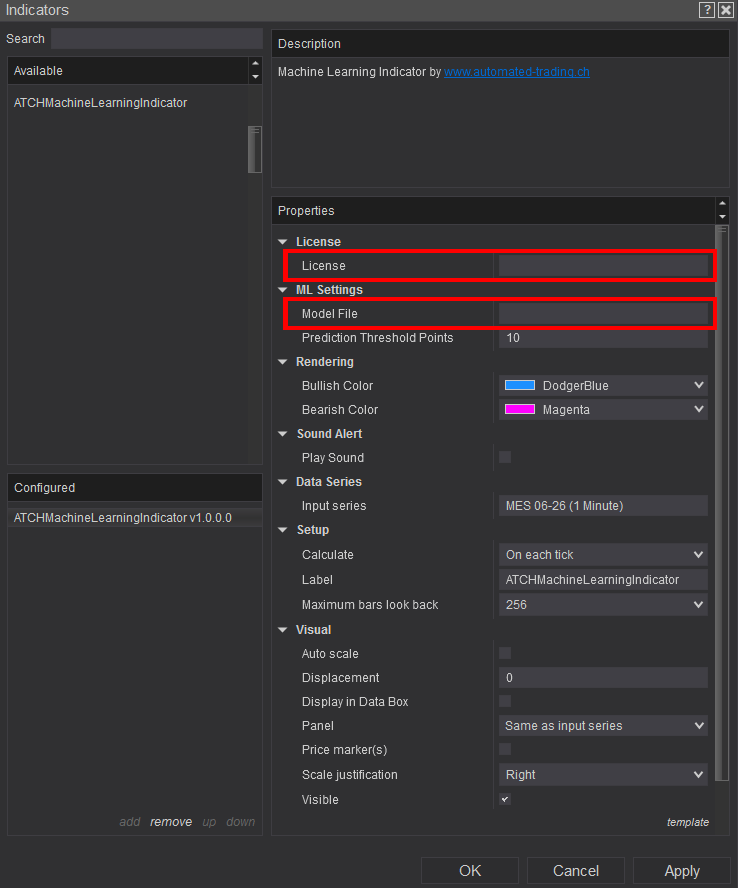
| License | This is the free license key you get when you create an account on automated-trading.ch. After creating an account, copy your license key from the billing page. You need to set this parameter only once per month. This indicator is totally free to use, but you need to register for a free account and license to use it. |
| ML Settings | |
| Model File | The full path to the trained machine learning model file (.zip format) — download it from the Installation section below and specify the full path. The model file contains the trained Random Forest regression algorithm used for predictions. |
| Prediction Threshold Points | Minimum predicted price movement (in points, from 0 to any positive number) required to generate a signal. The higher this value, the fewer signals produced. Default value: 10 points. |
| Rendering | |
| Bullish Color / Bearish Color | Color used to render bullish/bearish signals and indicators. |
| Sound Alert | |
| Play Sound | Enables/disables playing a sound when a signal is generated. |
| Play Sound File | Sets which .wav file is played on the sound alert. |
Download & Installation Instructions
License Requirements
At automated-trading.ch you can choose to either purchase a monthly subscription to use our premium products, or use our free products without subscribing.
In both cases, you need to create an account so you can get a License you can use for both premium and free products.
To obtain your license, simply sign up and then get your license on the billing page.
Download
You can also download this strategy — and every other automated-trading.ch strategy or indicator — anytime from your centralized Downloads page.
Installation Steps
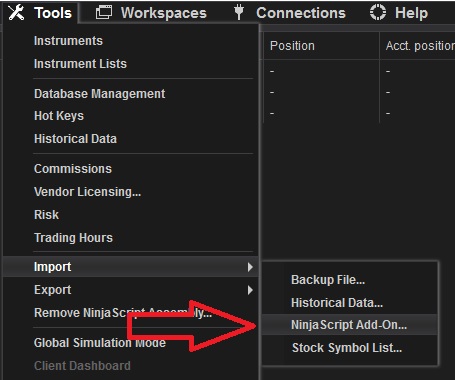
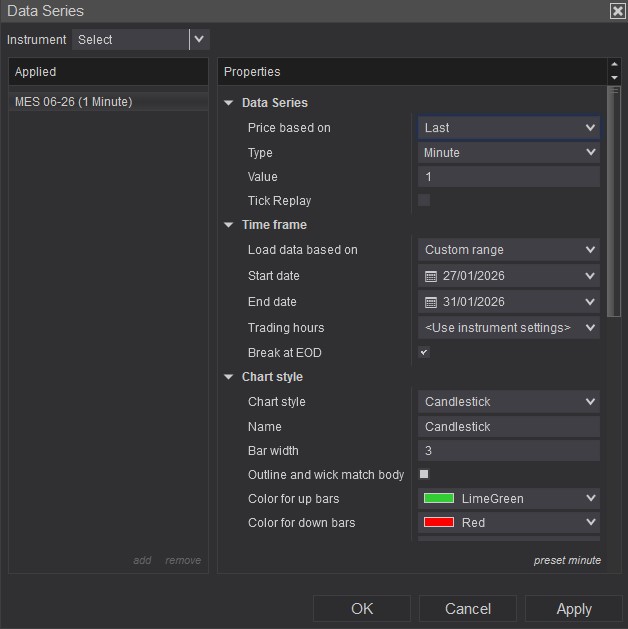
Frequently Asked Questions
General
Release Notes
- Updated Random Forest Model with two new Time-Sessions features; requires updating Model to 20260410-suffixed file version
- Bug Fix: real-time prediction executed each tick freezing NT/computer; now executes on bar close
- First Release of the Machine Learning Indicator