

ICT Concepts Indicator [Advanced]
 Created 06 Oct 2024
·
Updated 06 Jun 2026
Created 06 Oct 2024
·
Updated 06 Jun 2026
The ICT Concepts Indicator [Advanced] is a Premium NinjaTrader 8 indicator which displays key concepts of the ICT trading methodology and style.
Prerequisites
To properly use this indicator you should have the following prerequisites available.
- NinjaTrader 8, with any license type. Click here to download
- An automated-trading.ch account with an active Premium Subscription
Description
Those key concepts are the following:
- Change of Structure (or Change of Character, or Market Structure Shift) that indicates that the trend might change
- Break of Structure (or Market Structure Break) that indicates a continuation of the trend
- Fair Value Gaps, which represent displacements of price and are defined as instances of inefficiencies or imbalances visualized by three consecutive candles containing one large middle candle whose bordering candles' upper and lower wicks do not overlap
- Volume Imbalance (VIB), price voids created when market momentum causes rapid price movements, leaving empty space between candle bodies that act as market magnets
- Gap Imbalance (GIB), a more powerful form of imbalance where no wick closes through the gap, indicating an even stronger market inefficiency
- Order Blocks, which represent crucial support and resistance levels derived from aggressive price movement, and can be used as entry or exit levels
- Immediate Rebalances, price regions with no inefficiencies, no imbalances, and no gap that price needs to return to
- NWOG (New Week Opening Gap) — the price gap between Friday's closing price and Sunday's opening price
- NDOG (New Day Opening Gap) — the price gap between yesterday's closing price and today's opening price
- RTHG (Opening Range Gap) — marks the distance between the first opening tick of a session and the previous session's close
- Interactively control and manipulate the ICT zones on the chart
- Multi-timeframe capabilities
Examples
Change of Character (Market Structure Shift) and Break of Structure
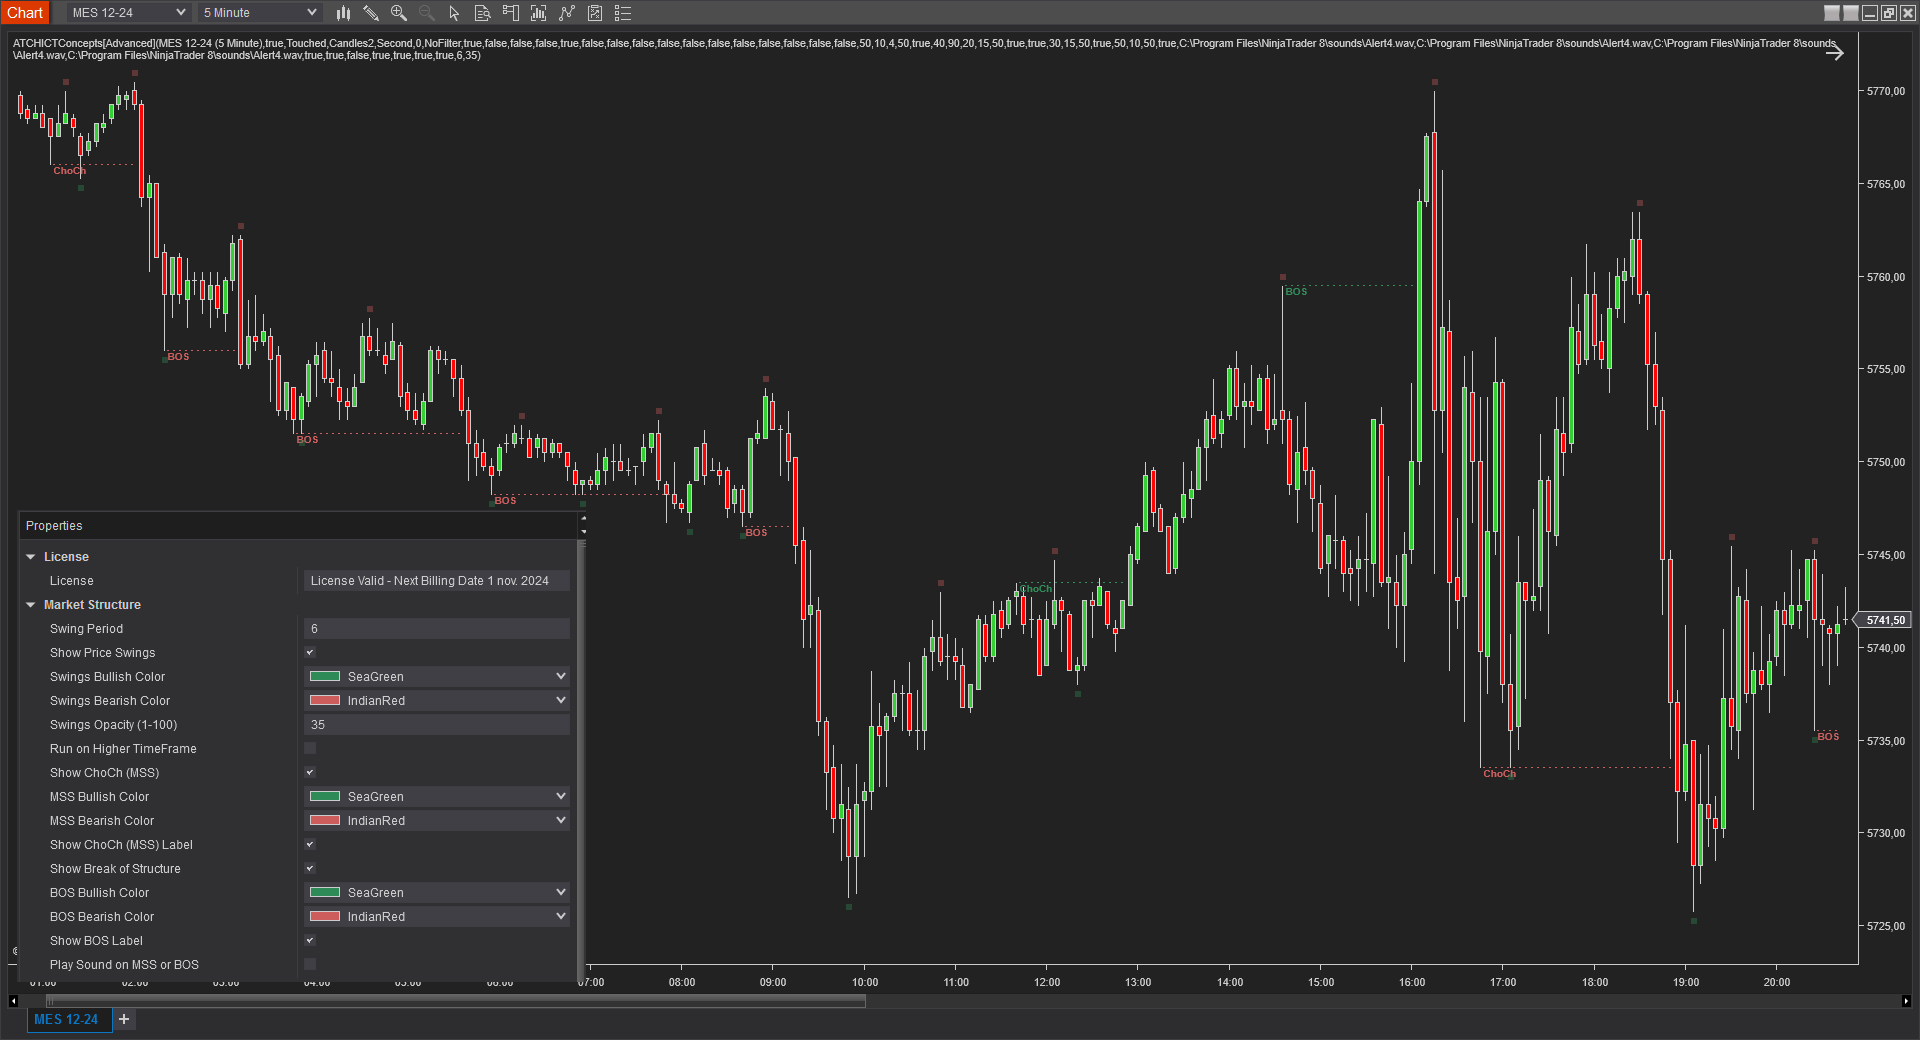
The market structure features of the indicator draw market structure shifts and breaks of structure. Market Structure Shifts are price breakouts indicating a probability of price changing direction; Break of Structure are price breakouts indicating a trend-direction continuation. These events are building blocks of the ICT methodology and can be used as bias determinants and filters to go long or short.
Running Market Structure Analysis on a Higher Timeframe
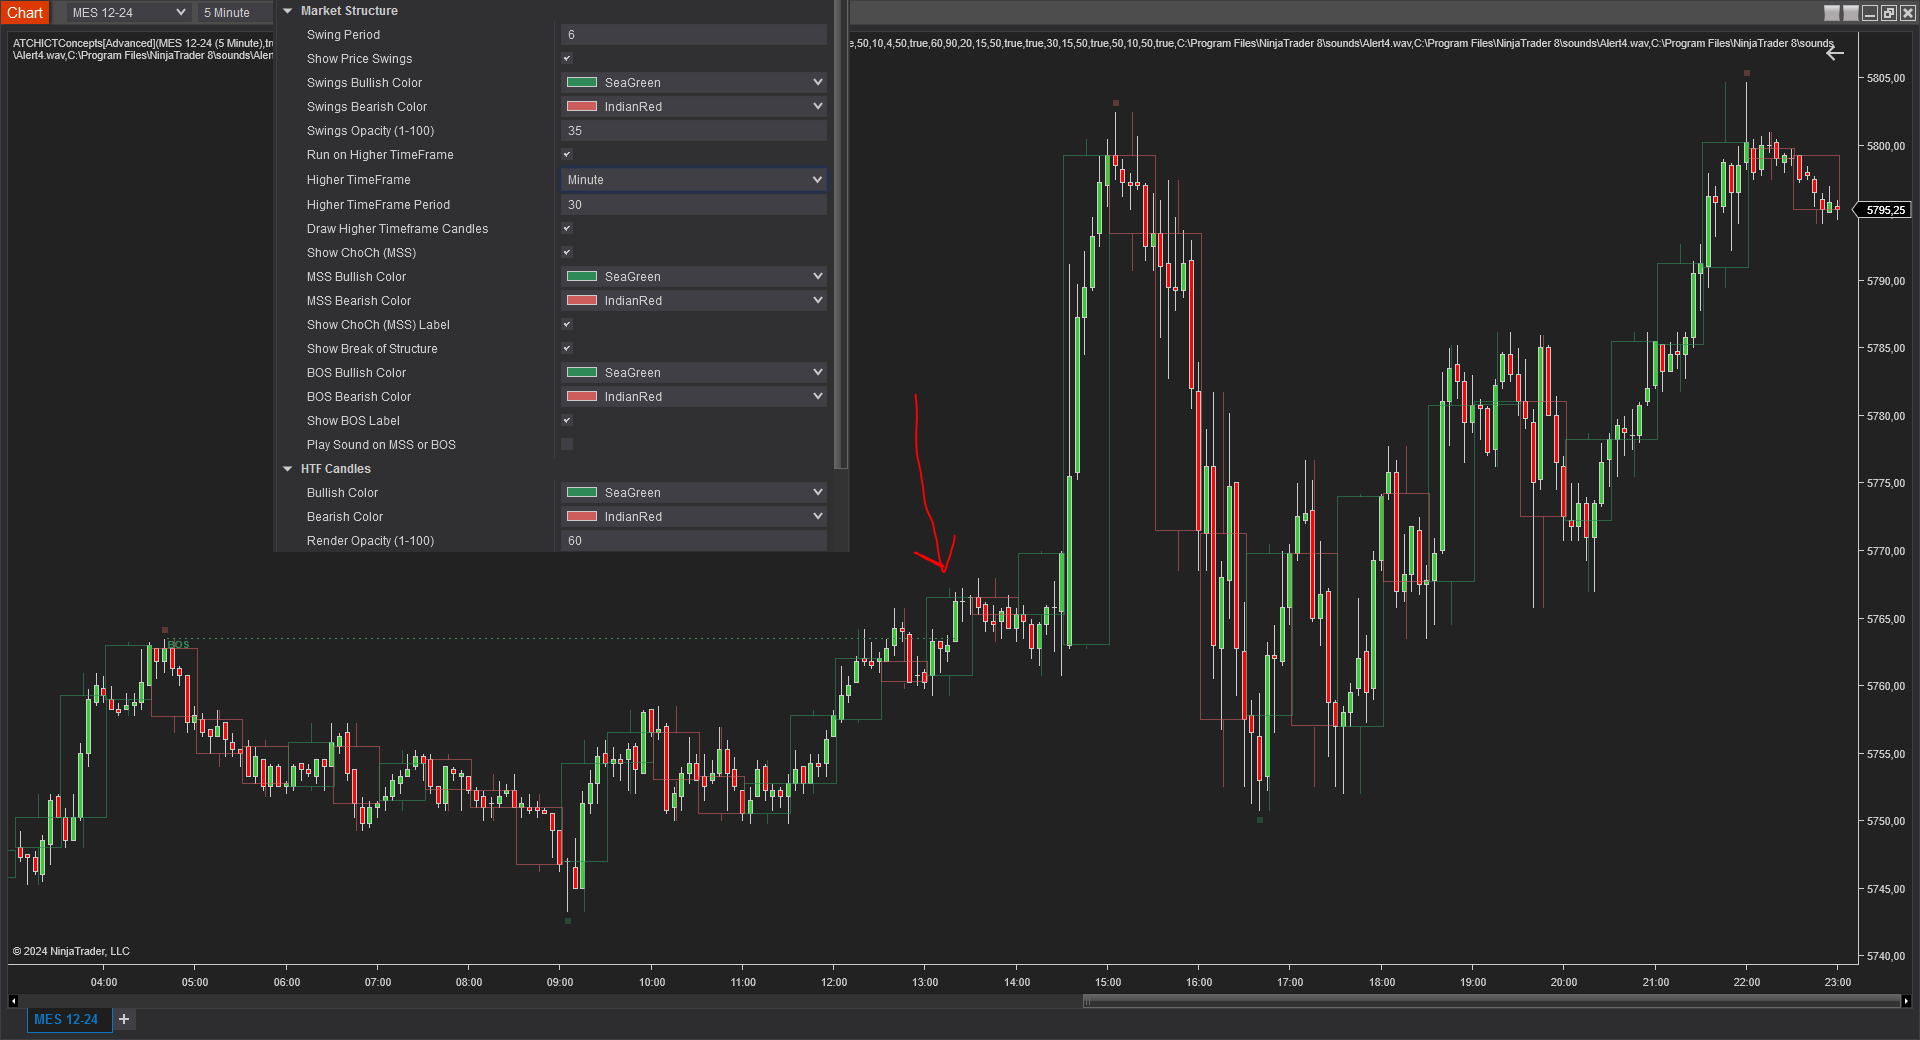
The indicator can run on a higher timeframe to allow top-down analysis — for example overlaying higher-timeframe candles (30 minutes) on top of the active chart's candles (5 minutes), detecting a BOS on the higher timeframe that leads to a large move a few minutes later.
Fair Value Gaps
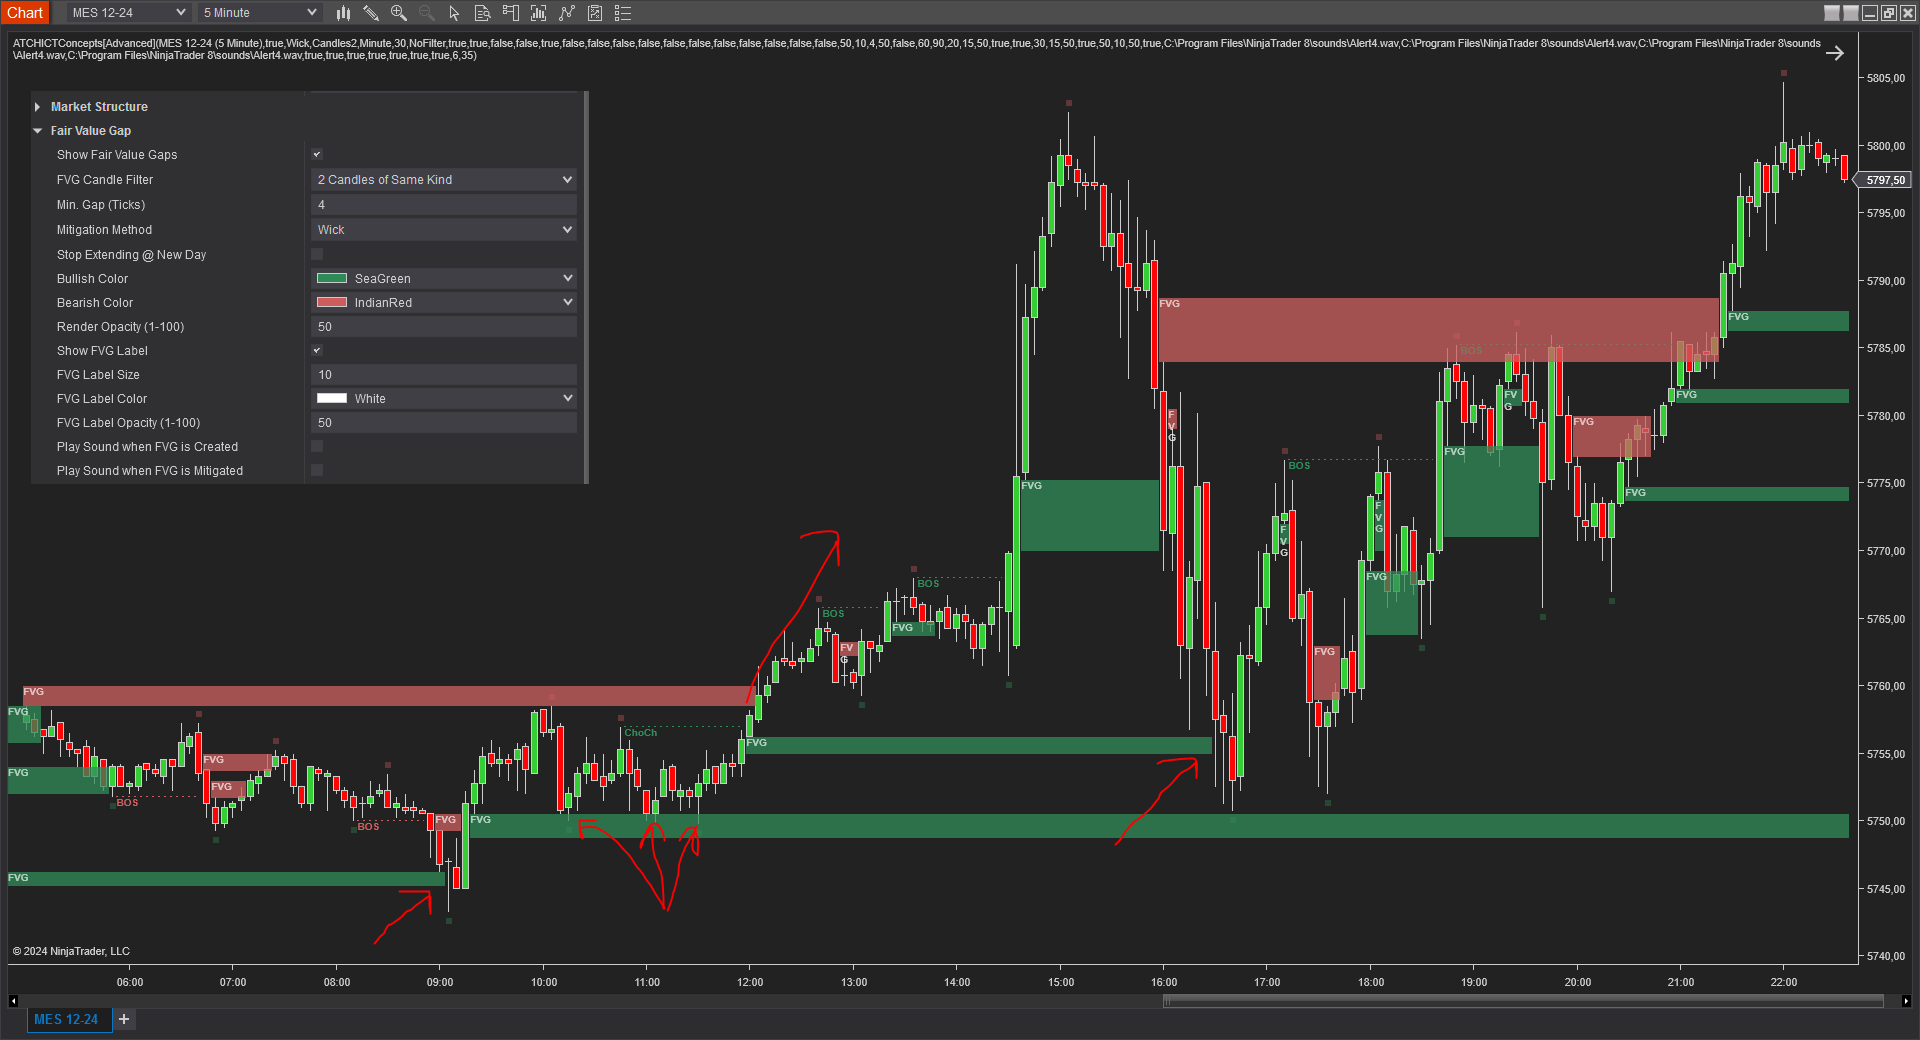
The indicator can detect several Fair Value Gaps — e.g. on the MES instrument on a 5-minute timeframe. Coupled with MSS and MSB, FVGs can be a very good signal to enter a trade. Bullish FVGs are drawn in green, bearish FVGs in red, and their drawing stops once mitigated. Common entry setups include a clear rejection after a bullish FVG is retested (stop loss at the swing low of the rejection candle), three touch points on an FVG zone followed by a clear ChoCh and a new FVG formation, or a clean rebound on the FVG zone. FVG analysis and detection can also run on a higher timeframe if Run on Higher Timeframe is enabled — and multiple instances of the indicator can be added to the same chart with different timeframes for advanced multi-timeframe top-down analysis.
Volume Imbalance (VIB)
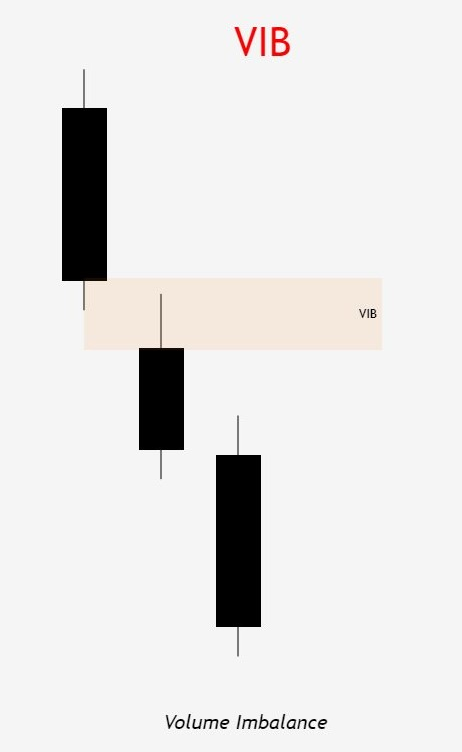
Volume Imbalance (VIB) occurs when the market moves with strong momentum, creating price voids between consecutive candle bodies. Unlike Fair Value Gaps, which rely on specific three-candle patterns with non-overlapping wicks, Volume Imbalances form more rapidly during aggressive price movements.
Bullish Imbalance: forms when the open price of the second candle is higher than the close price of the first candle, leaving empty space between the two bodies — price the market did not trade through due to strong buying pressure. Bearish Imbalance: forms when the open price of the second candle is lower than the close price of the previous candle's body — price levels skipped over due to aggressive selling pressure.
Volume Imbalances act like market "magnets" because the market moved too quickly to fill those prices — price typically revisits these areas to balance orders and provide liquidity before continuing a trend, making them valuable zones for both entry and exit strategies. VIB zones can be traded similarly to FVGs — entering when price revisits and retests the zone, or using them as additional confluence with other ICT concepts like Order Blocks or Market Structure events.
Gap Imbalance (GIB)
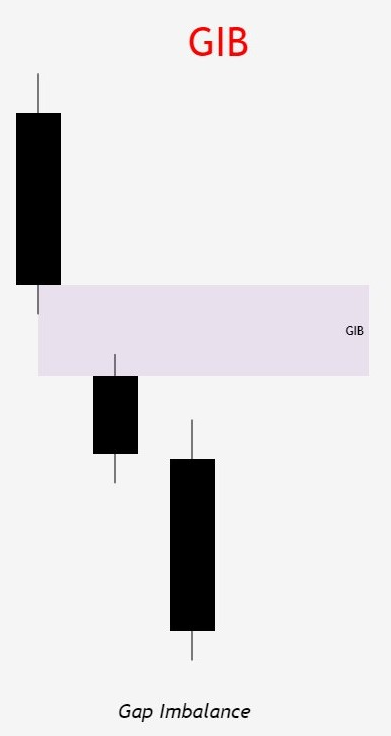
Gap Imbalance (GIB) follows the same principles as Volume Imbalance but with an additional, more restrictive condition: no wick can close through the gap — a Gap Imbalance forms when consecutive candles create a gap between their bodies and neither candle's wick penetrates the opposite candle's body, so the gap remains completely untouched by any price movement.
The fact that no wick closes through a GIB zone indicates extremely strong directional momentum, making GIBs a more aggressive and reliable imbalance signal than standard VIBs. GIB zones act as powerful magnets for price and are typically revisited with stronger conviction than VIBs. Combining GIBs with Market Structure events and Order Blocks creates a high-confluence setup for disciplined traders looking for high-probability trade entries.
Order Blocks
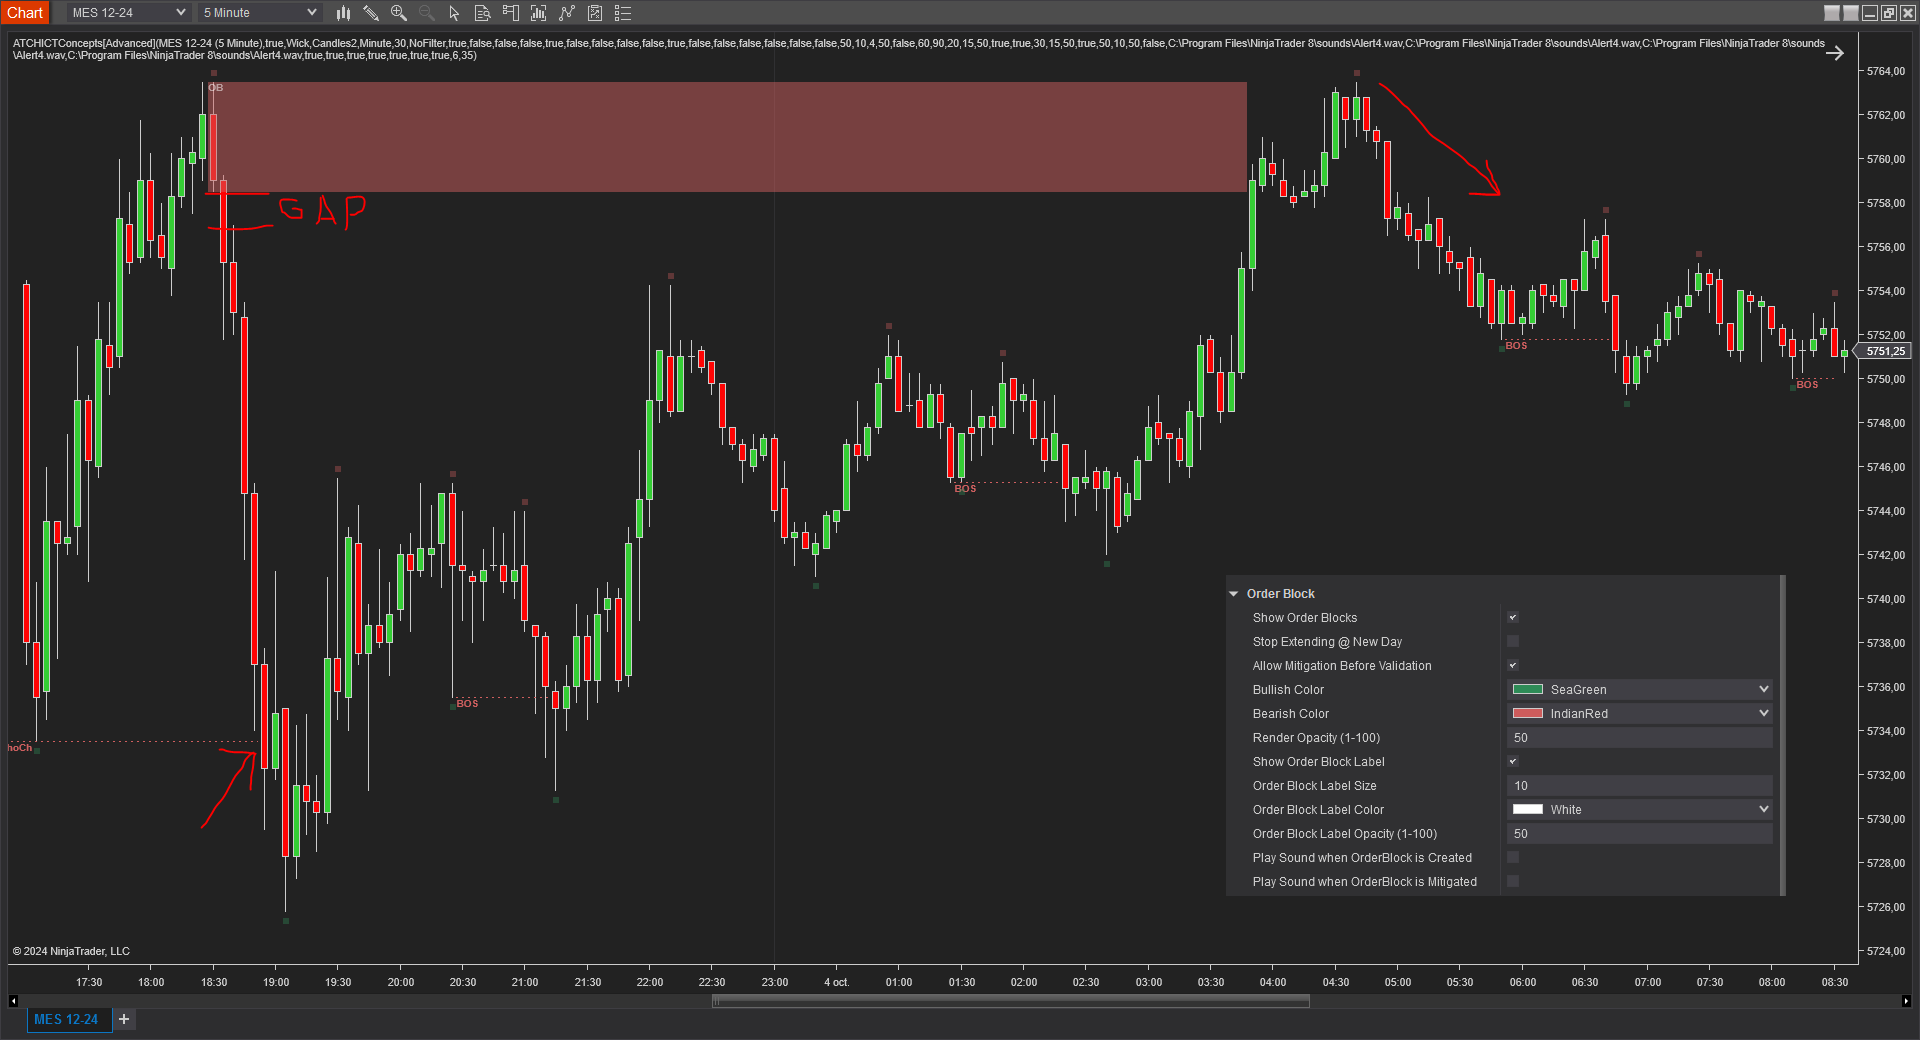
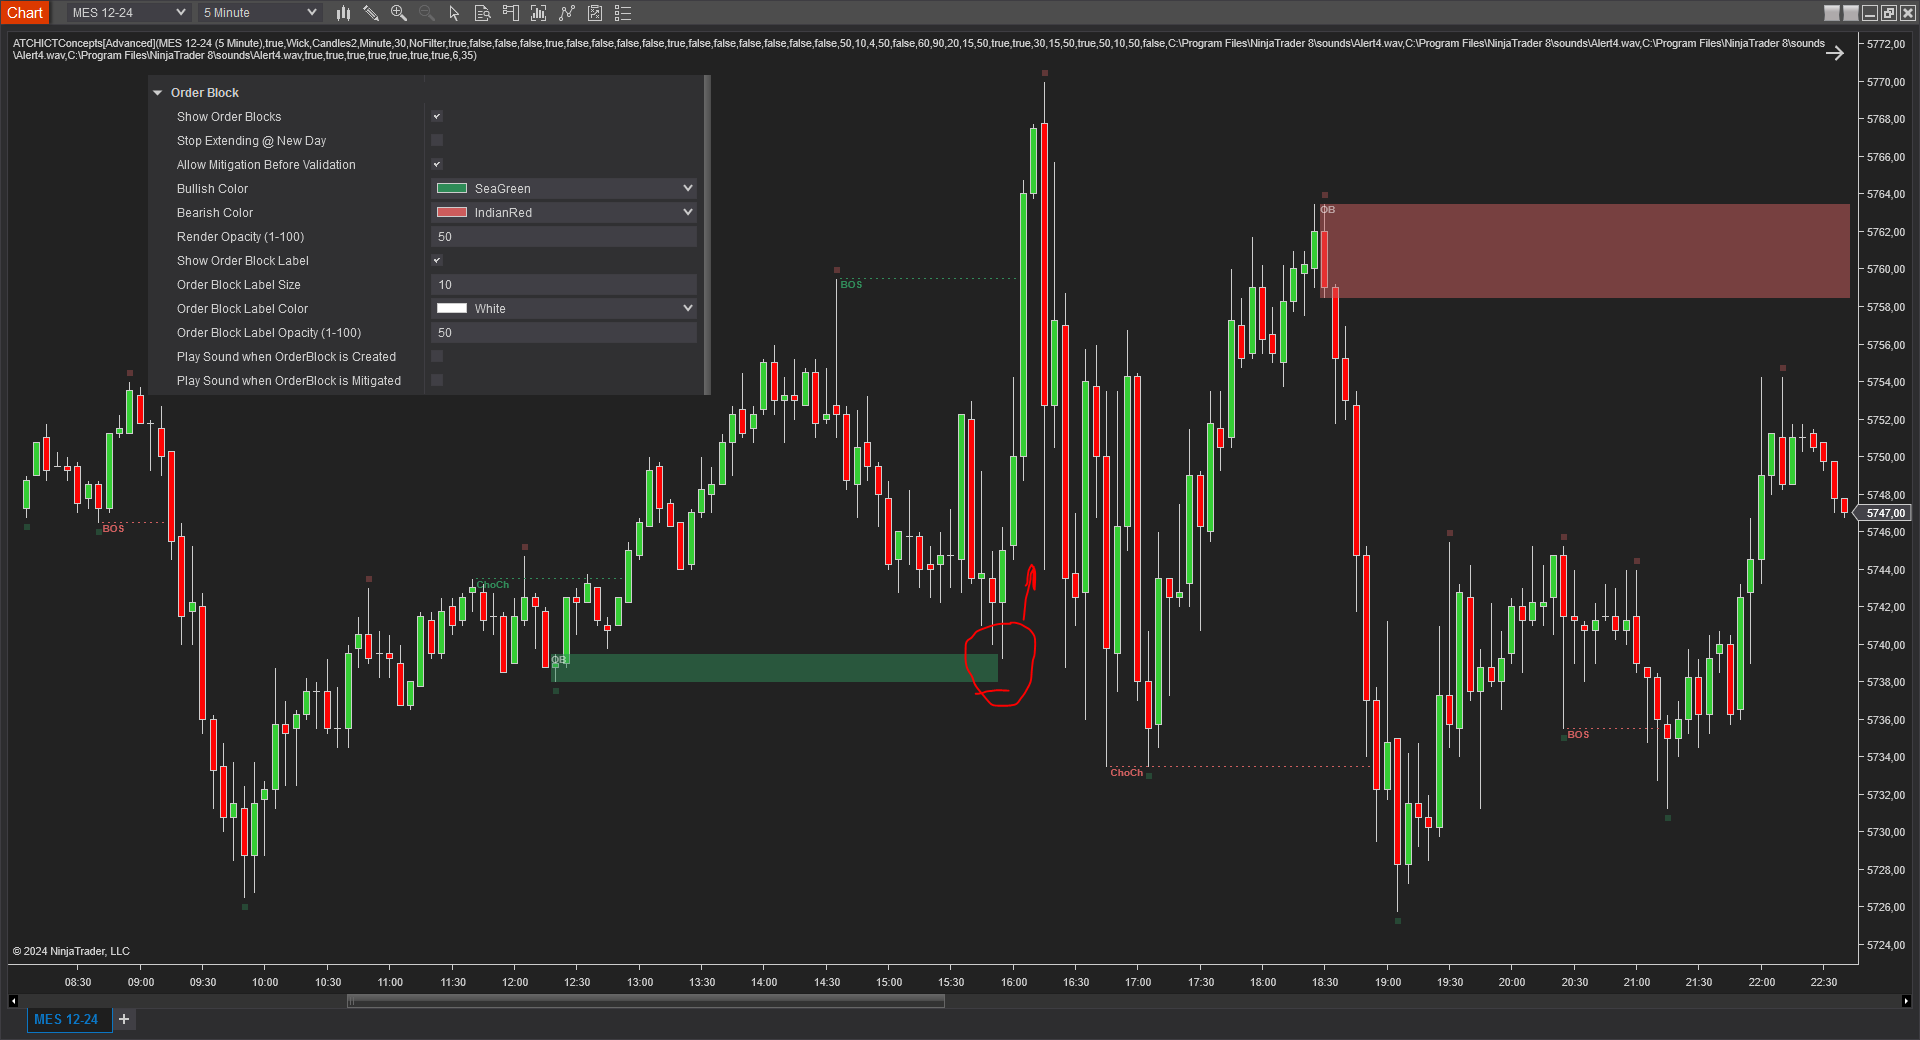
Order Blocks are defined as zones created from the last high swing candle (for bearish) or the last low swing candle (for bullish) before a Market Structure Shift or a Break of Structure, with two additional rules: the candle defining the Order Block should be followed by an FVG, and the Order Block zone should not be mitigated before the breakout creating the Market Structure event. Order Blocks are traded when price revisits them — a bearish order block that formed an FVG right after the candle defining its zone, then wasn't mitigated until the ChoCh, can be shorted when price mitigates the zone and moves back down; the mirror setup applies to bullish order blocks, with a stop loss set at the block's lower level, typically targeting a 1:1 win/loss ratio.
Immediate Rebalances
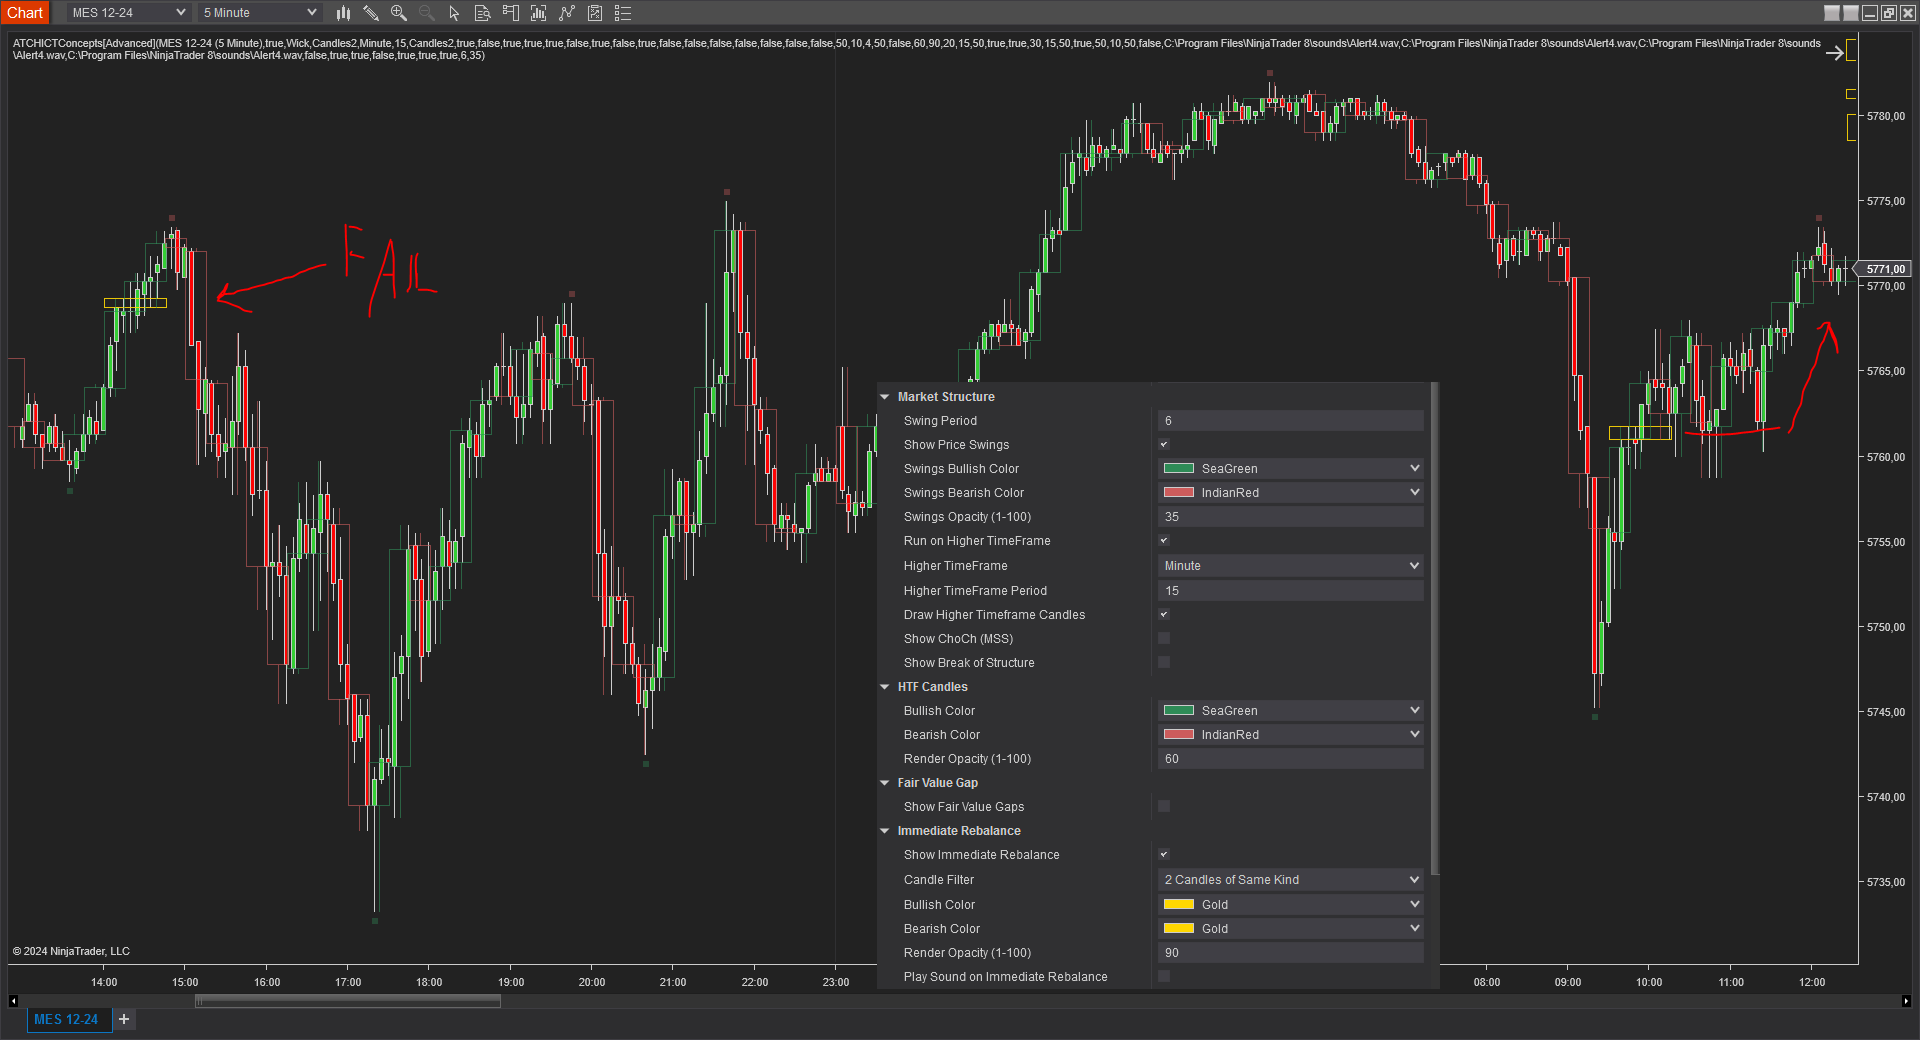
Immediate rebalances, a concept taught by ICT, hold significant importance in decision-making. Where a Fair Value Gap arises from market inefficiencies or imbalances, an Immediate Rebalance leaves no gap, no inefficiencies, and no imbalances that price would need to return to. An Immediate Rebalance is successful when price marks a continuation in its direction, and failed when price immediately reverses and goes back the opposite way — both outcomes can hold significance in trading when analyzed alongside other ICT items. For example, running the indicator on a 15-minute higher timeframe over a 5-minute MES chart with higher-timeframe candles overlaid, a first IR marked "Fail" (price immediately pulled back and broke the IR level) can flag a bearish bias, while an IR that holds price above it across multiple swing points, with price ultimately moving higher, flags a bullish bias.
NDOG (New Day Opening Gap)
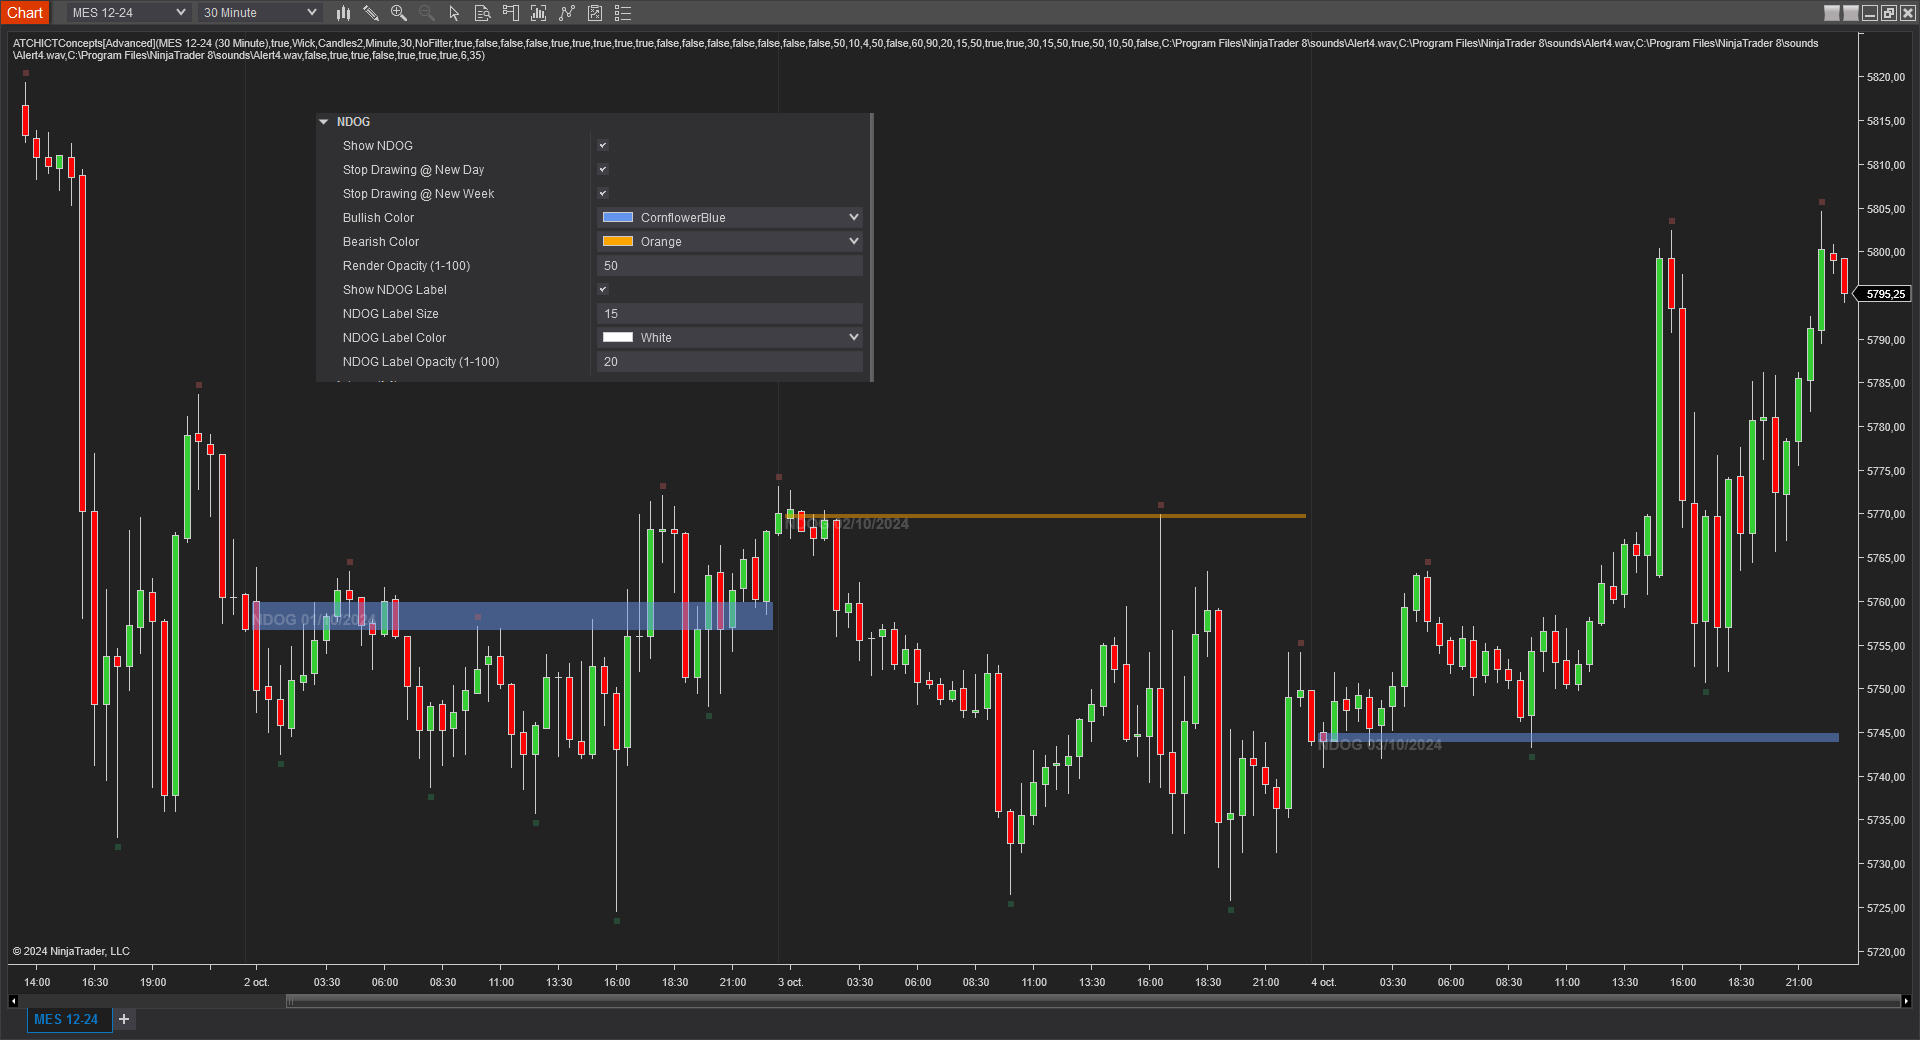
The New Day Opening Gap (NDOG) is defined by ICT as the separation in time/price caused by the 1-hour break that occurs each day in the futures market — the opening price of the gap is the very first tick at the 6:00pm (UTC-4) restart, compared against the previous session's 5:00pm closing price. These gaps can act as liquidity draws as well as general reference points for determining daily bias.
RTH Gap (Opening Range Gap)
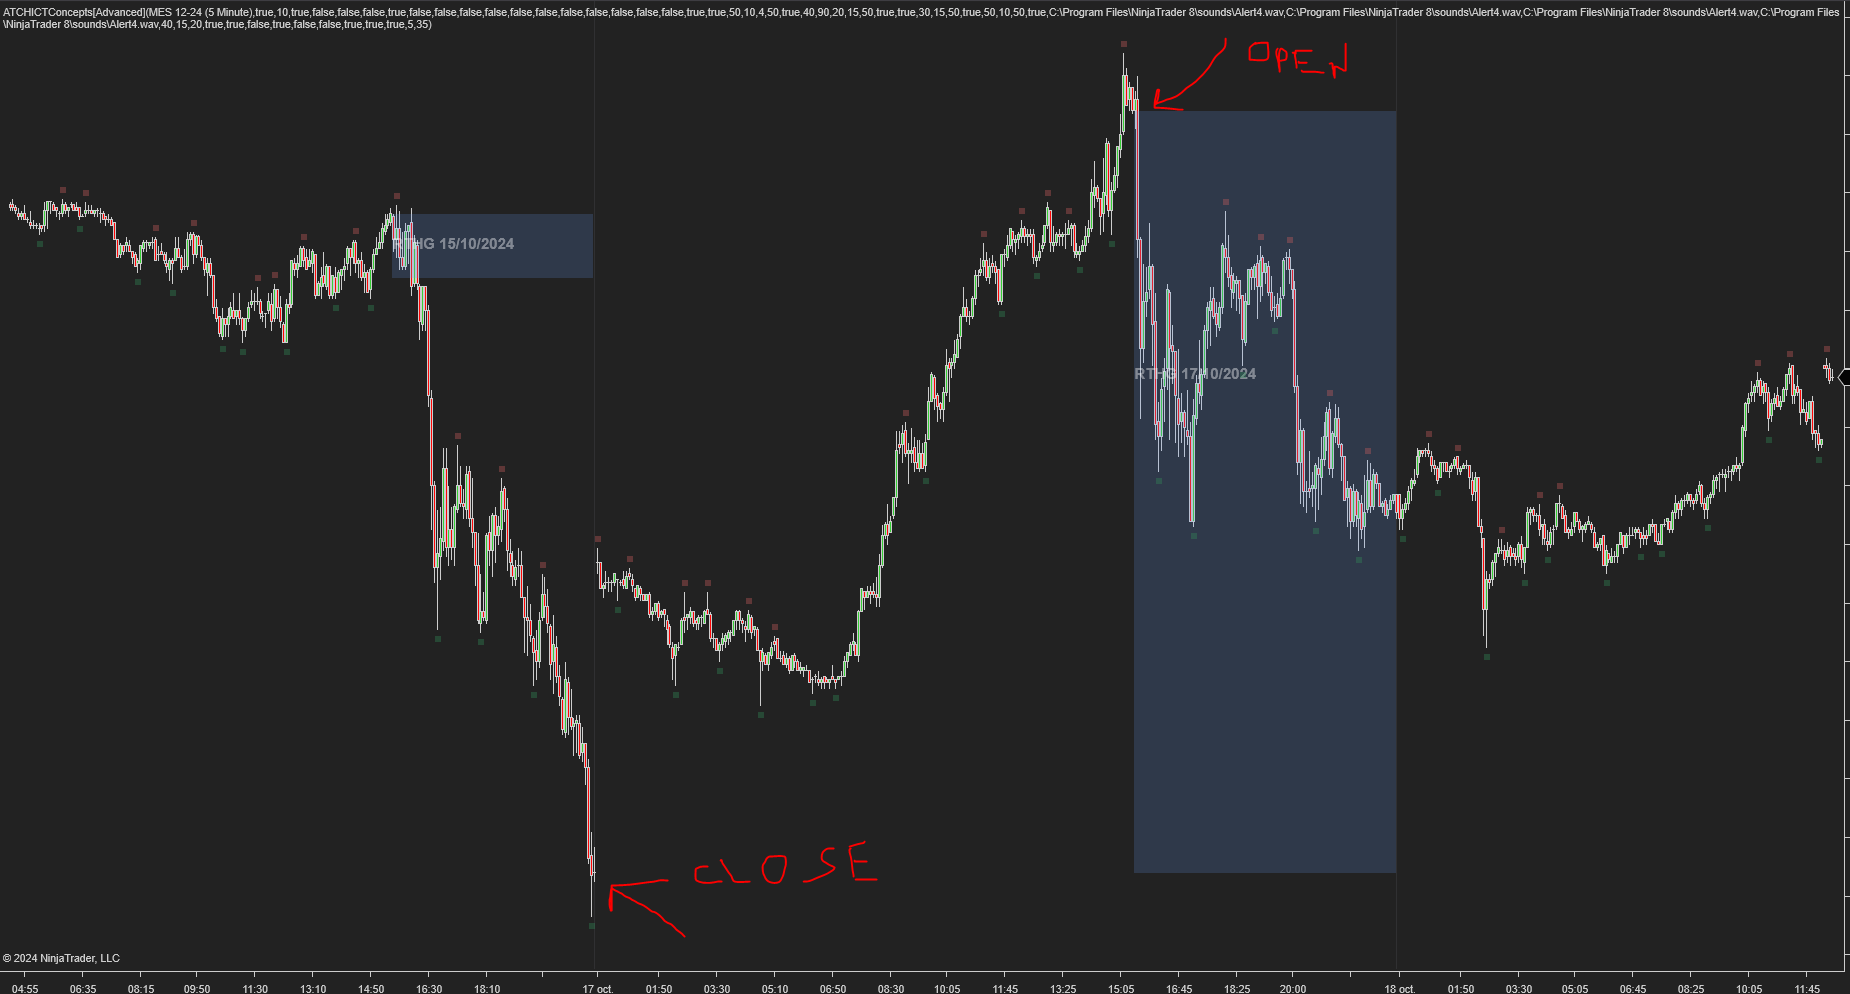
The Opening Range Gap, also known as the Regular Trading Hours (RTH) Gap, is the distance between the first opening tick of a session and the previous session's close, when looking at a chart's Regular Trading Hours (not to be confused with Electronic Trading Hours) — occurring between 4:15pm (UTC-4) and 9:30am the next day.
NWOG (New Week Opening Gap)
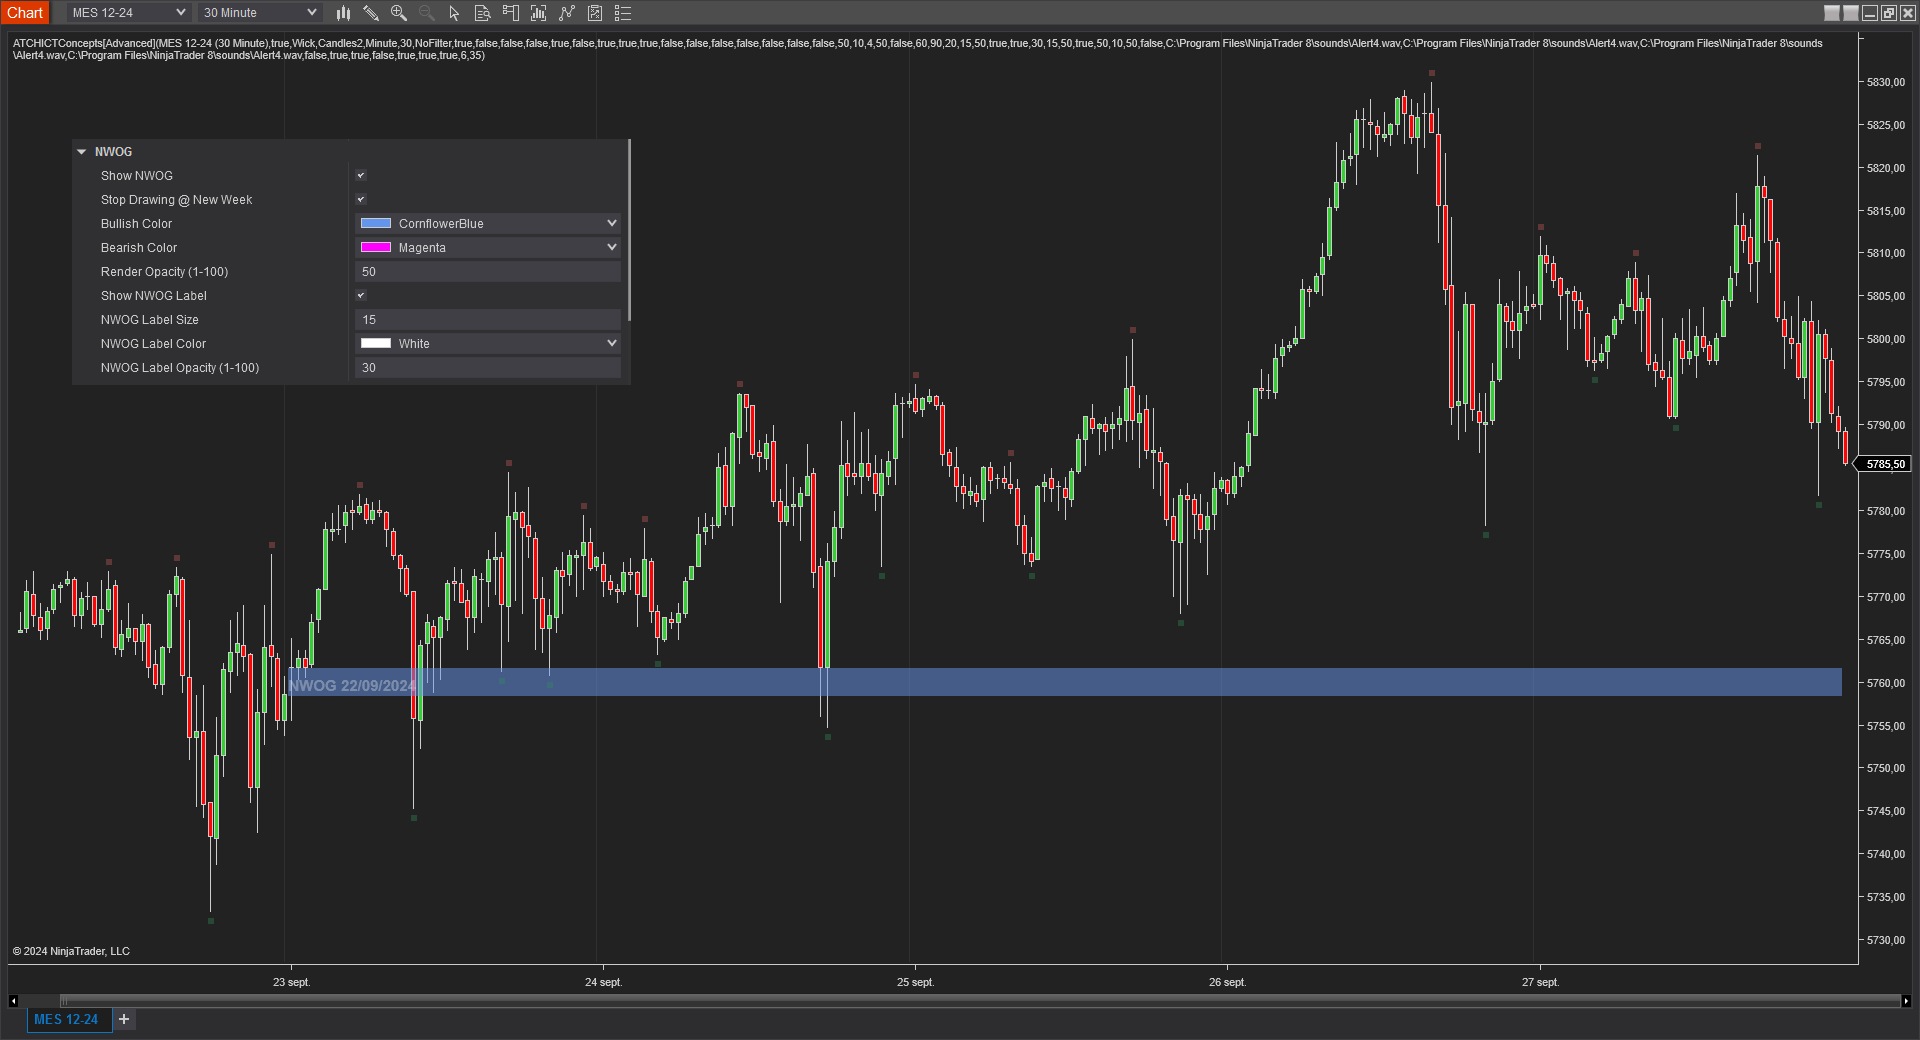
The NWOG is the gap between Friday's closing price and Sunday's opening price. These gaps can act as liquidity draws as well as general reference points for determining weekly bias.
Interacting With ICT Zones on the Chart
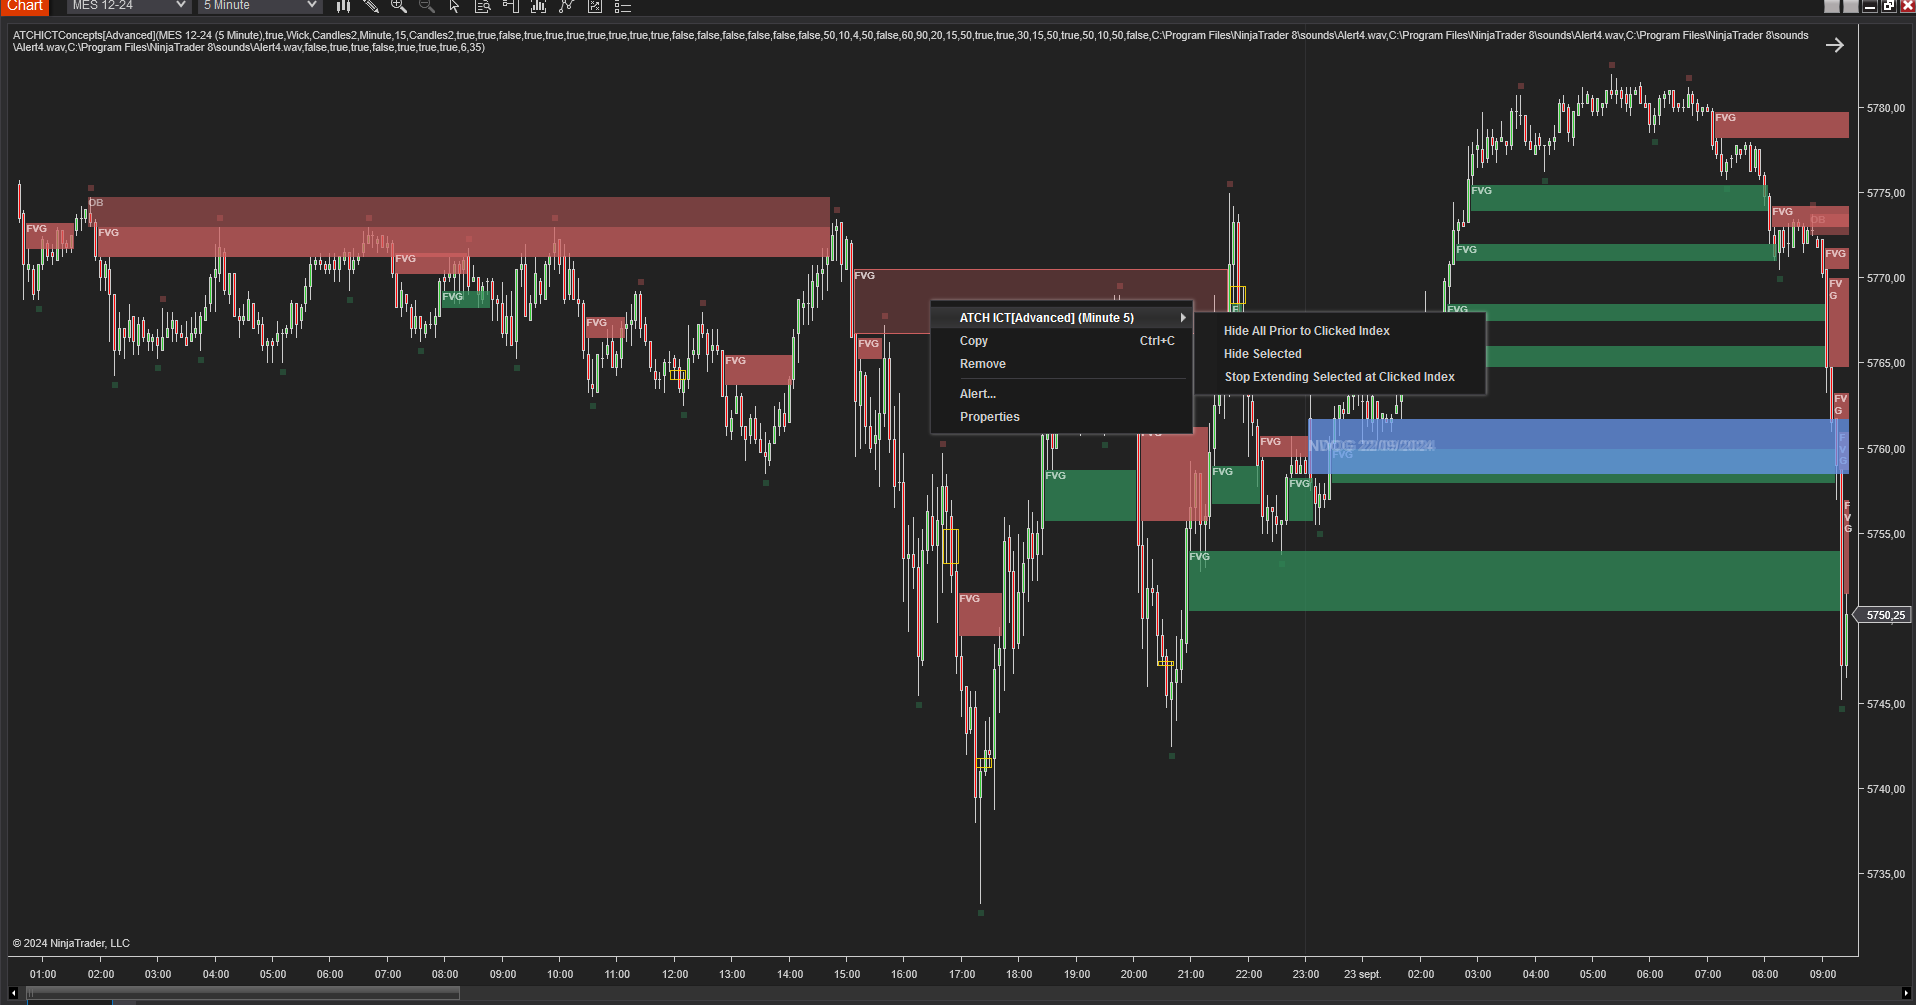
One of this indicator's unique features is interactivity. All ICT zones drawn on the chart can become interactive by enabling the Interactivity parameter — select an individual item on the chart, then right-click to see a context menu entry named ATCH ICT[Advanced] with several command buttons: Hide All prior to clicked Index (hides all ICT zones before where you clicked, to unclutter past events that are no longer pertinent), Hide Selected (hides the selected zone), and Stop Extending Selected at Clicked Index (stops the selected zone at the clicked bar index) — with more commands planned in future releases.
Features
The ICT Concepts [Advanced] indicator has a set of unique features:
- Can be run on a higher timeframe while drawing on a lower timeframe, allowing multi-timeframe analysis
- Can overlay drawing of higher-timeframe candles when run on a Higher Timeframe
- Can play a sound alert on each ICT zone
- Can be run with or without TickReplay on any time-based or price-based chart
- Interactive commands and operations applicable to ICT zones on the chart by right-clicking
- Active development and constantly adding new features
Parameters
We always try to keep the parameters to a minimum.
| License | |
| License | This is the license key you get when you create an account on automated-trading.ch. After creating an account, copy your license key from the billing page. You need to set this parameter only once per month. |
| Market Structure | |
| Swing Period | Sets how many bars are enough to separate two swings of the same type. The higher this value, the fewer swings overall; the lower, the more. A value of 3 or 4 is typical. |
| Show Price Swings | Enables/disables drawing a mark below/above swing price points. Useful to see how market structure is analyzed, since swing points are the building blocks of the algorithm. |
| Swing Bullish Color / Swing Bearish Color | Sets the color of low and high swing points, respectively. |
| Swing Opacity (1-100) | Opacity of the swing points drawing, from 0 (transparent) to 100 (fully opaque). |
| Run On Higher TimeFrame | Enables/disables running the ICT analysis algorithms on a higher timeframe and displaying the ICT zones on the active chart. |
| Higher TimeFrame / Higher TimeFrame Period | Selects the higher timeframe and its period when Run On Higher TimeFrame is enabled. Must be a bigger timeframe than the active chart's — e.g. if the chart is on 15 Minutes, pick something like 1 Hour; picking a smaller timeframe will not work. |
| Draw Higher Timeframe Candles | Enables drawing (overlaying) higher-timeframe candles on top of the active chart. |
| Show ChoCh (MSS) | Enables/disables drawing of Change of Characters, also known as Market Structure Shifts. |
| MSS Bullish Color / MSS Bearish Color / MSS LineStyle | Color and line style used to draw MSS lines. |
| Show Choch (MSS) Label | Shows a label on each MSS on the chart. |
| Show Break of Structure | Enables/disables drawing of Break of Structures. |
| BOS bullish Color / BOS bearish Color / BOS LineStyle | Color and line style used to draw BOS lines. |
| Show BOS Label | Shows a label on each Break of Structure on the chart. |
| Play Sound on MSS or BOS / Play Sound File | Plays a sound alert when a market structure event (MSS or BOS) occurs, and sets which .wav file is played. |
| HTF Candles (visible only when Run on Higher Timeframe is enabled) | |
| Bullish Color / Bearish Color / Render Opacity (1-100) | Color and opacity used to draw bullish/bearish higher-timeframe candles. |
| Fair Value Gap / Volume Imbalance (VIB) / Gap Imbalance (GIB) | |
| These three zone types (Fair Value Gap, Volume Imbalance, Gap Imbalance) each expose their own identical set of parameters, prefixed accordingly (e.g. "Show Fair Value Gaps" / "Show Volume Imbalance" / "Show Gap Imbalance"). | |
| Show [Zone] | Enables/disables drawing of that zone type. |
| Candle Filter |
Filters detection of the zone.
|
| Min. Gap (ticks) | Minimum distance in ticks between the wicks/bodies for the zone to be valid. The higher this value, the fewer zones detected; the lower, the more. |
| Mitigation Method |
Sets which method is used to consider the zone mitigated by price (Fair Value Gap only — VIB/GIB use the same options).
|
| Stop Showing Mitigated | Hides the zone's drawing once mitigated, for a cleaner chart. |
| Stop Extending @ New Day | Stops the zone's drawing from extending into a new day (can also be done per-zone by clicking it). |
| Show 50% Level | Draws the consequent encroachment (50%) level on the zone. |
| Shrink FVG | Fair Value Gap only — shrinks the FVG's drawing each time it's touched by a candle's wick. |
| Bullish Color / Bearish Color / Render Opacity (1-100) | Color and opacity used to draw bullish/bearish zones. |
| Show [Zone] Label / Label Size / Label Color / Label Opacity (1-100) | Shows a label on each zone, and its text size, color, and opacity. |
| Play Sound when [Zone] is created / mitigated / Play Sound File | Plays a sound alert when the zone is created and/or mitigated (useful for trading pullbacks), and sets which .wav file is played. |
| Immediate Rebalance | |
| Show Immediate Rebalance | Enables/disables display of Immediate Rebalances. |
| Candle Filter | Same 3/2/no-filter options as above, applied to Immediate Rebalance detection. |
| Bullish Color / Bearish Color / Render Opacity (1-100) | Color and opacity used to draw Immediate Rebalances. |
| Play Sound on Immediate Rebalance / Play Sound File | Plays a sound alert when an IR is created, and sets which .wav file is played. |
| Order Block | |
| Show Order Blocks | Enables/disables display of Order Blocks. |
| Stop Extending @ New Day | Stops Order Block zones from extending into a new day (can also be done per-zone). |
| Allow Mitigation Before Validation | Normally an Order Block must not be mitigated by price to be valid — this parameter allows an exception, letting Order Blocks be valid even if mitigated before their creation. |
| Confirmation Mode |
Sets the mode that confirms formation of the Order Block.
|
| Bullish Color / Bearish Color / Render Opacity (1-100) | Color and opacity used to draw Order Blocks. |
| Show Order Block Label / Label Size / Label Color / Label Opacity (1-100) | Shows a label on each Order Block, and its text size, color, and opacity. |
| Play Sound when OrderBlock is created / mitigated / Play Sound File | Plays a sound alert when an Order Block is created and/or mitigated, and sets which .wav file is played. |
| NWOG / NDOG / RTHG | |
| These three gap types (New Week Opening Gap, New Day Opening Gap, Opening Range Gap) each expose their own identical set of parameters, prefixed accordingly. | |
| Show NWOG / Show NDOG / Show Opening Range Gap | Enables/disables display of that gap type's zones. |
| Stop Drawing @ New Day / @ New Week | Stops the gap zone's drawing from extending into a new day/week (NWOG only has the New Week variant; can also be done per-zone by clicking it). |
| Show 50% / 75% / 25% Level | Draws the corresponding quadrant encroachment level on the zone. |
| Bullish Color / Bearish Color / Render Opacity (1-100) | Color and opacity used to draw bullish/bearish zones. |
| Show [Gap] Label / Label Size / Label Color / Label Opacity (1-100) | Shows a label on each zone, and its text size, color, and opacity. |
| Interactivity | |
| Enable Interactivity | Enables/disables interactivity features when right-clicking ICT items on the chart. |
| Hide Selected | Hides the clicked zone — useful to hide a specific ICT zone (FVG, Order Block, NDOG, NWOG...). |
| Hide All Prior to Clicked Index | Hides all zones to the left of the clicked bar index — useful to unclutter the chart from a certain point in time onward. |
| Stop Extending Selected @ Current Bar | Resizes the clicked zone to the clicked bar index and stops it from extending further — e.g. to stop an Order Block that's no longer of interest, or to stop the current day's NDOG zone from extending at a certain time so it doesn't overlap other zones. |
Download & Installation Instructions
License Requirements
At automated-trading.ch you can choose to either purchase a monthly subscription to use our premium products, or use our free products without subscribing.
In both cases, you need to create an account so you can get a License you can use for both premium and free products.
To obtain your license, simply sign up and then get your license on the billing page.
Download
You can also download this strategy — and every other automated-trading.ch strategy or indicator — anytime from your centralized Downloads page.
Installation Steps
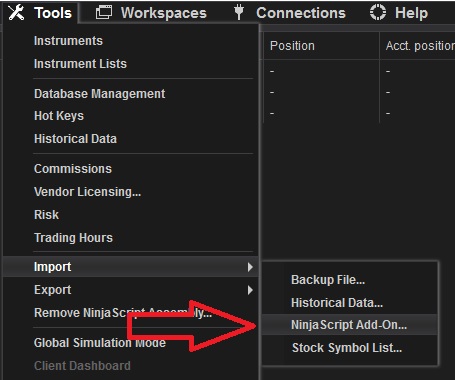
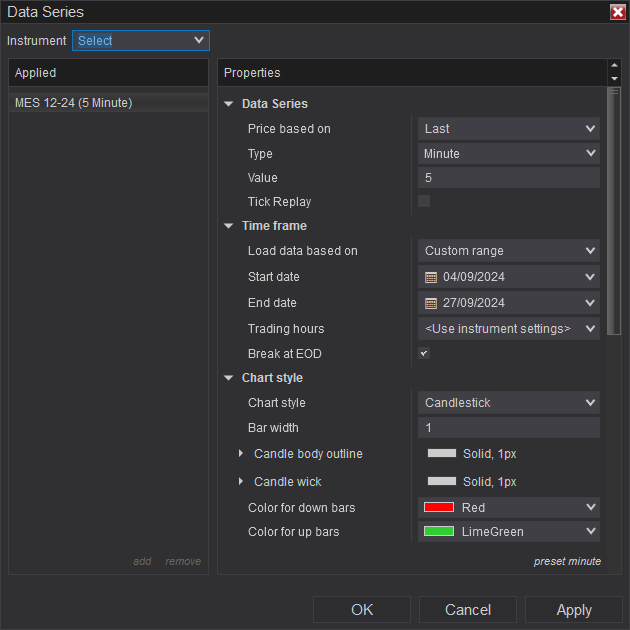
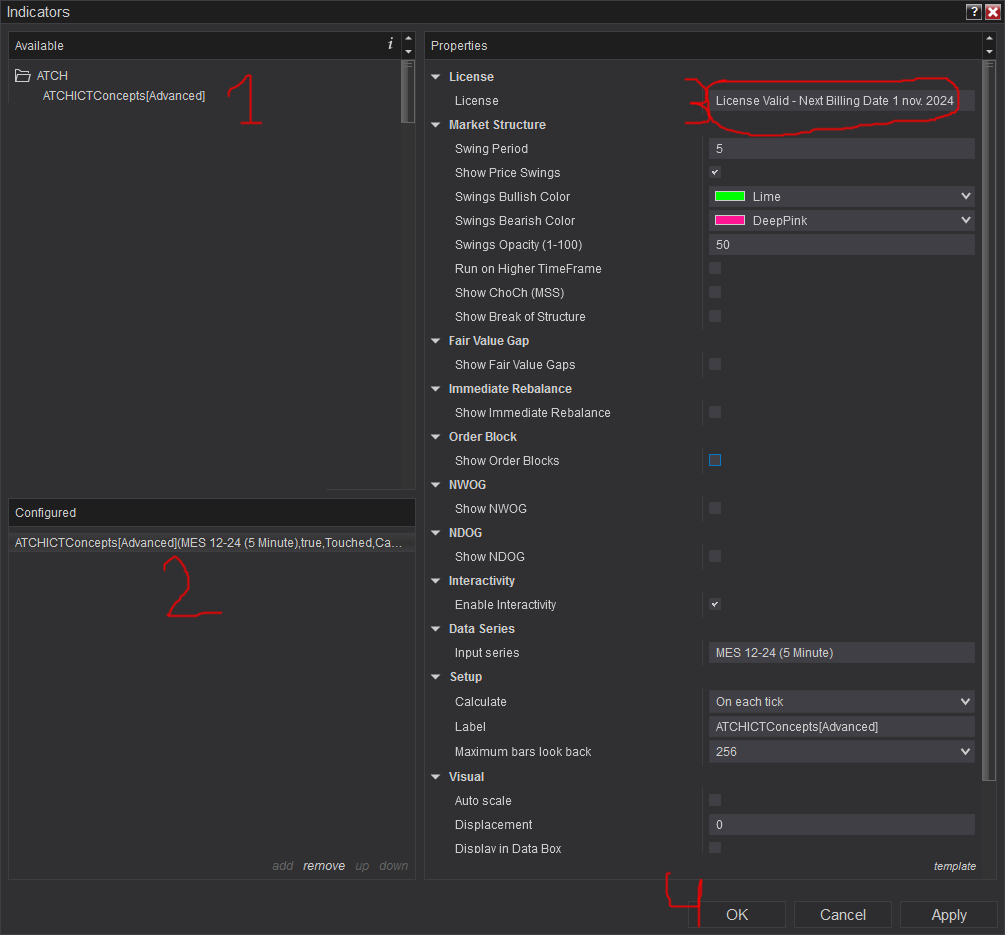
Frequently Asked Questions
General
Subscriptions Q&A
Release Notes
- Added Volume Imbalance (VIB); Added Gap Imbalance (GIB)
- Fix Bug when checking license
- Fix Bug: indicator hides Grid lines when added to chart
- Fix bug on labelling FVG as "OB"; Adding Shrinking FVG rendering (user requested)
- Fix bug on rendering causing indicator to stop working
- Added "Stop Showing Mitigated" Fvg parameter
- Added consequent encroachment 50%/25%/75% to NDWOG, NWOG, RTGH, FVGs; Added Confirmation Mode parameter to OrderBlock section; Fix: RTH Gap can now be removed interactively
- Added Linestyle for MSS and BOS line drawing; Removed Log output slowing performance
- Added RTH Gap (Opening Range Gap)
- Fix NDOG and NDWOG opacity
- Fix false positive virus detection
- Fix License detection error
- Fix installation error
- First Release of the indicator