Summary
The Volume Imbalances is a free NinjaTrader 8 Indicator that highlights diagonal volume imbalances on both footprint charts and regular candlestick charts
Imbalances occurs on price levels where trade volume on one side (bid/ask) is excess over the trade volume on the opposite side. Hence, Diagonal Bid/Ask imbalance displays aggressive buy market orders lifting the offer and aggressive sell market orders hitting the bid
A large number of imbalances in a row is an indication of future powerful movement in that direction.
We highly recommend joining our discord community by following this invite link
![]()
Prequisites
To use this indicator you should have available the following prequisites
- NinjaTrader 8. Click here to download
- OrderFlow data NinjaTrader account that can be obtained by either purchasing a lifetime NinjaTrader license or by using a license provided by
one of our recommended trader funding programs:
We highly recommend Apex and Earn2Trade
- automated-trading.ch account to obtain a free license key. To obtain the license key, simply Signup and then get your license on the billing page
Description
Imbalance in footprint or candlestick chart highlights the price levels where a buy trade volume is excess over a sell trade volume. Diagonal Bid/Ask imbalance displays aggressive buy market orders lifting the offer and aggressive sell market orders hitting the bid.
In this imbalances indicator you can specify the minimum ratio between buyers and sellers volume. For example, Ratio = 3 will show on the chart all the imbalances, where the excess of buying over selling will be above 300%.
Stacked Imbalances shows zones of multiple consecutive imbalances that occur on bid or ask side. These zones are important support/resistance levels because they are levels where participants aggressively wanted to get into the market. So when the market retests those levels, the same participants may appear again. For example, when you get stacked imbalances of 3 or more on top of one another it is a good sign of strong pressure in the market and that the market will continue in that direction.
Here are few examples of how the indicator works:
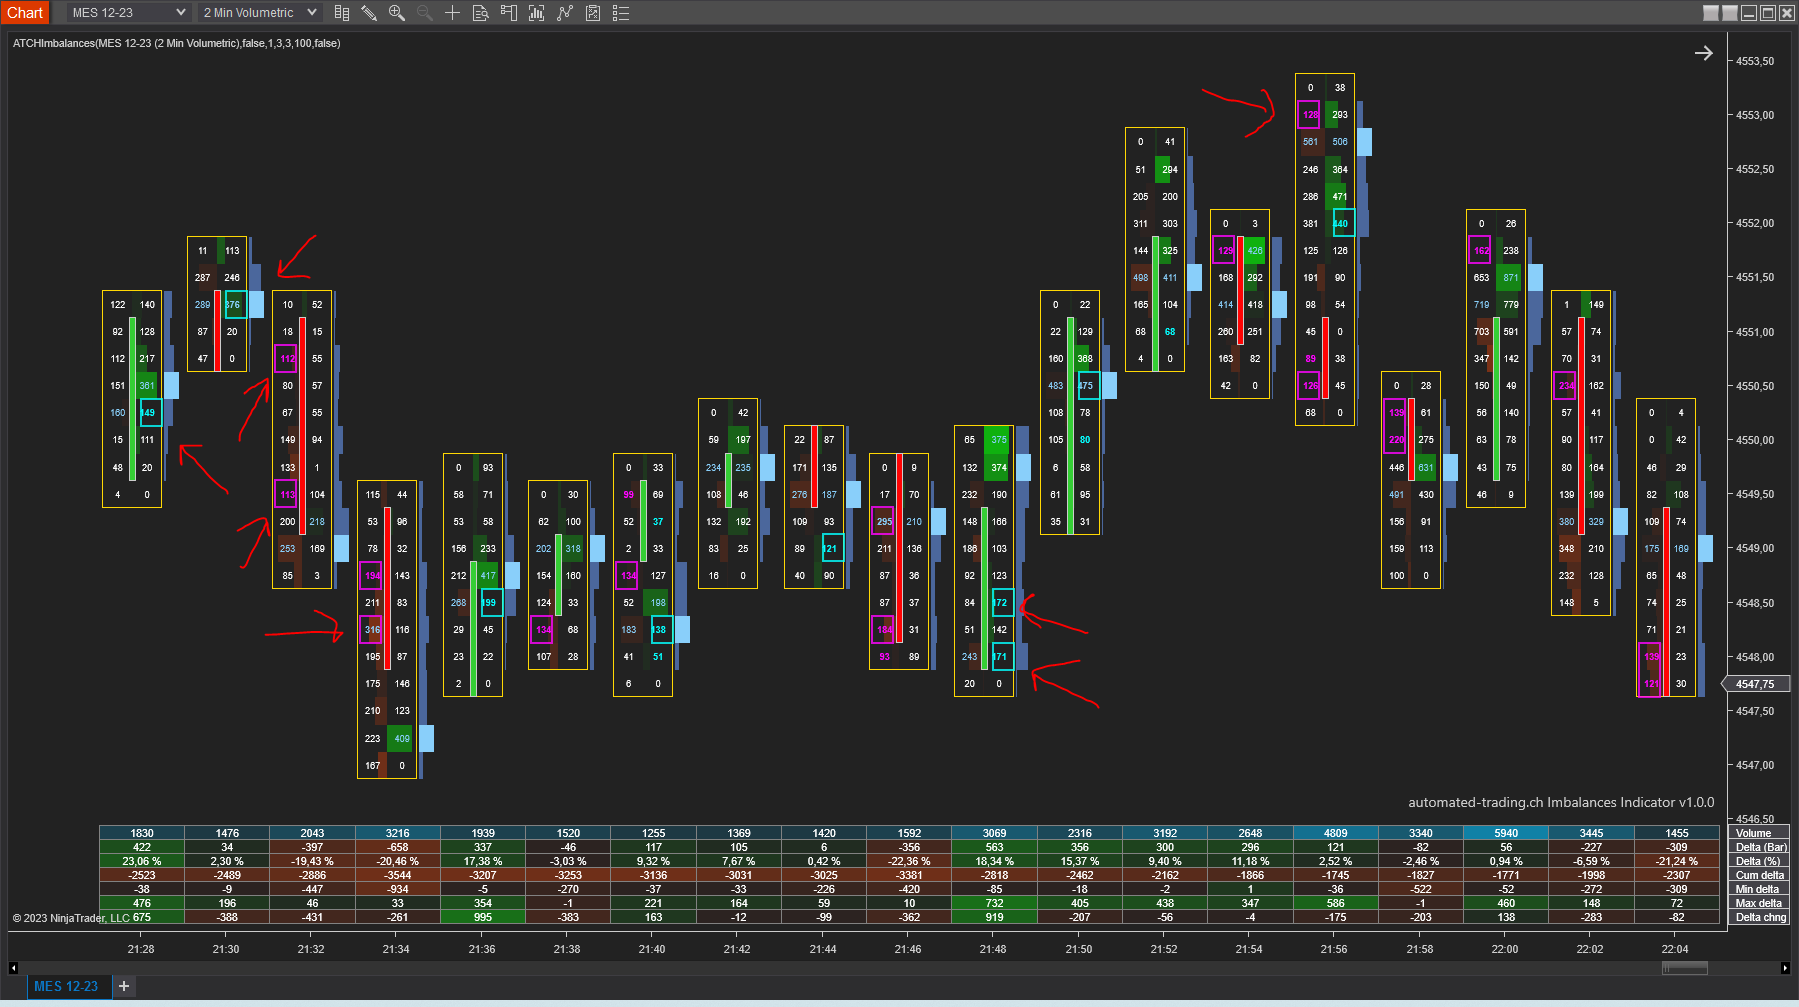
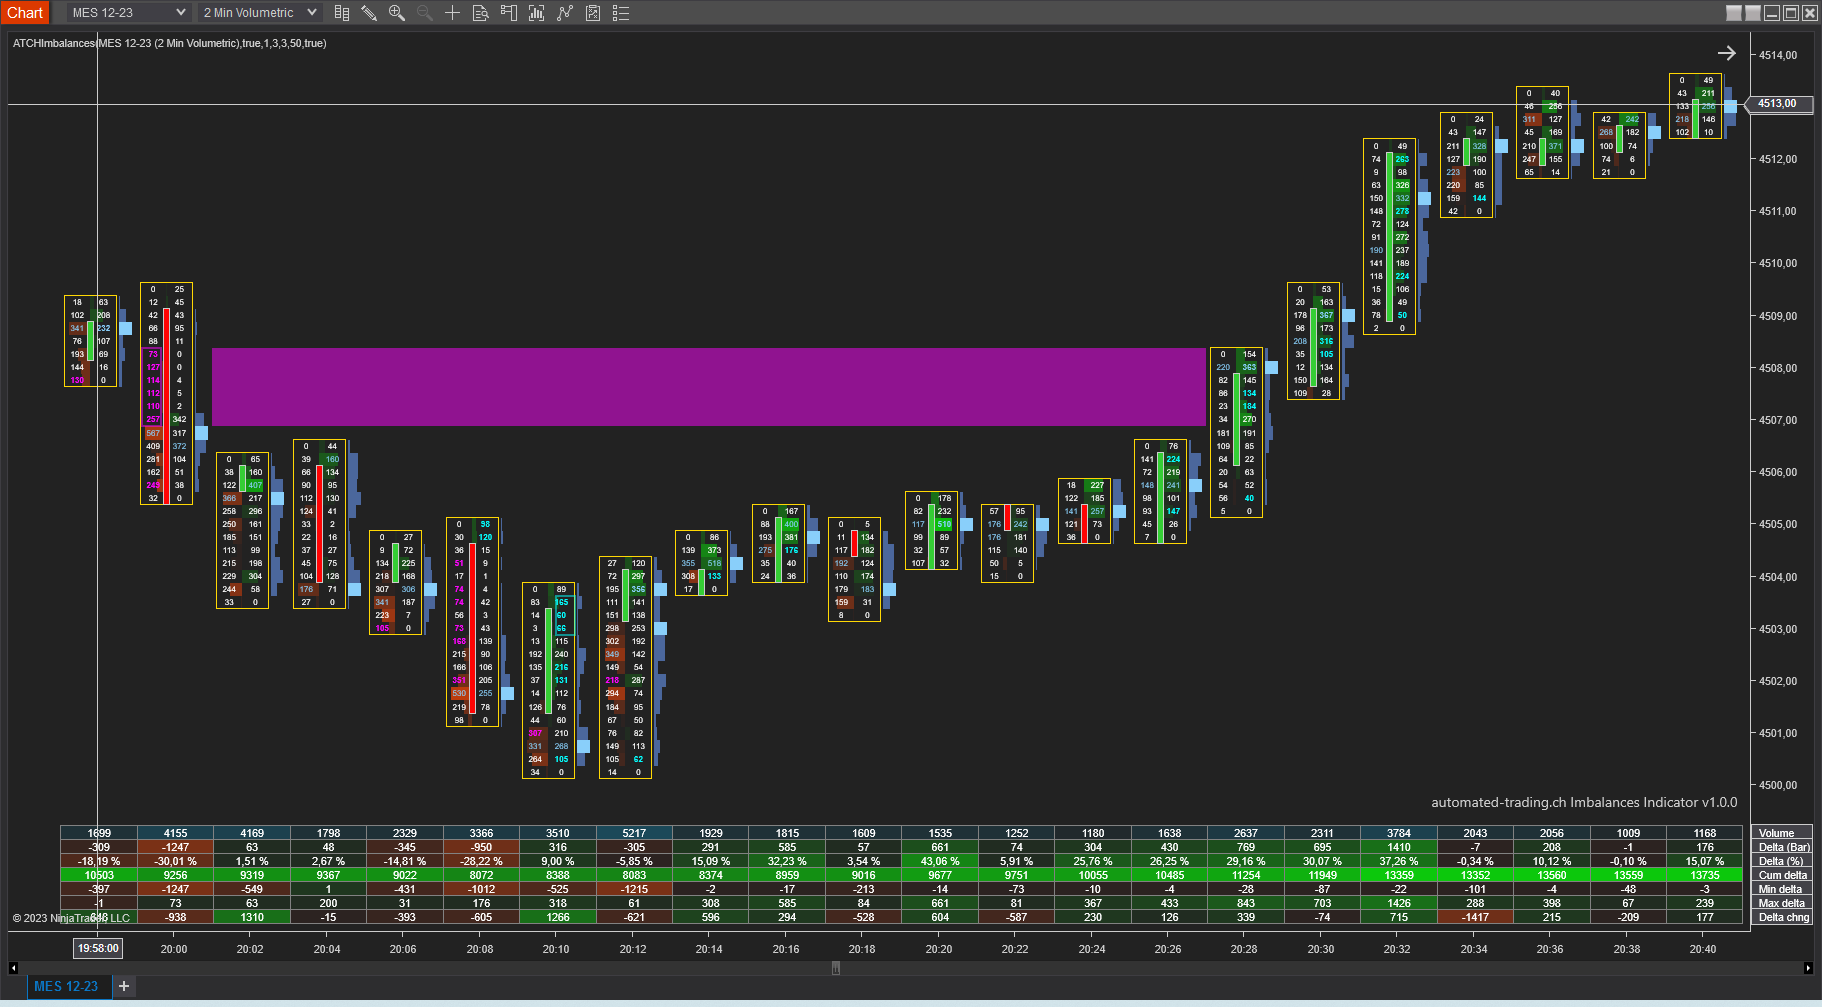
In this example, adding the imbalances indicator on a MES footprint chart will draw rectangles on each bid/ask level that has diagonal volume balance
The imbalance ratio in this example is 3 and the minimum imbalance volume is 100. The buy imbalance color is Cyan and the sell imbalance volume is Magenta
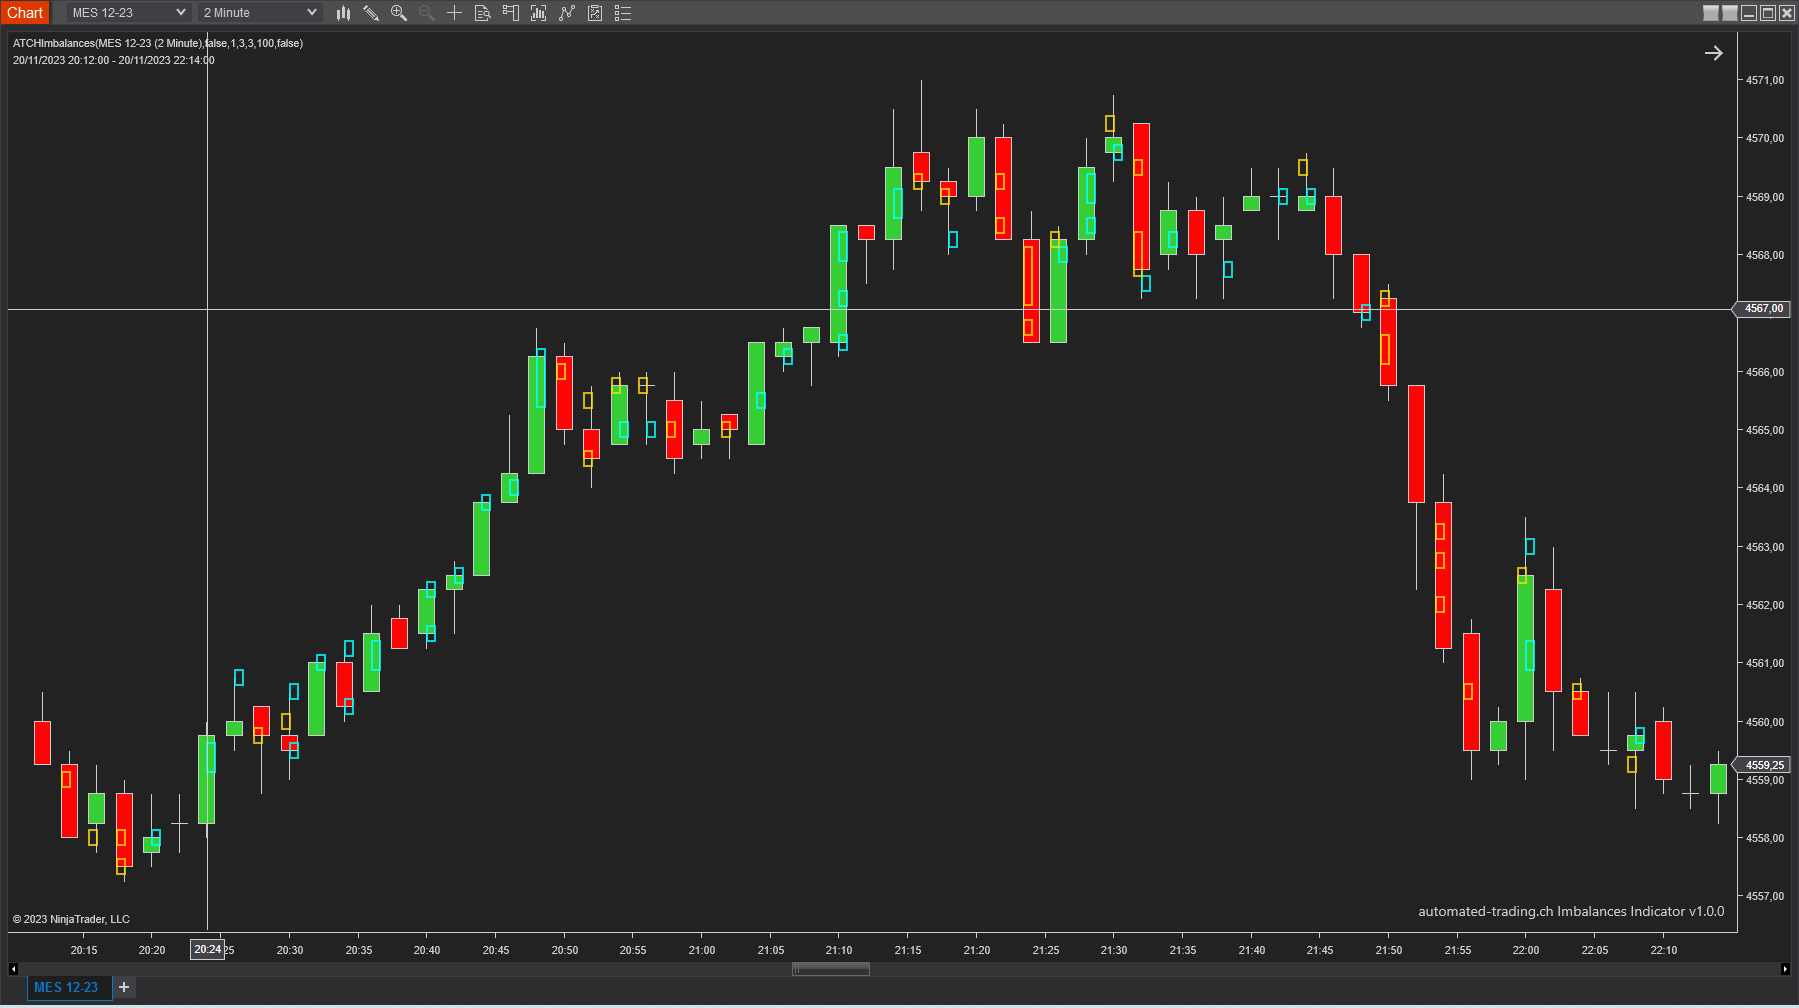
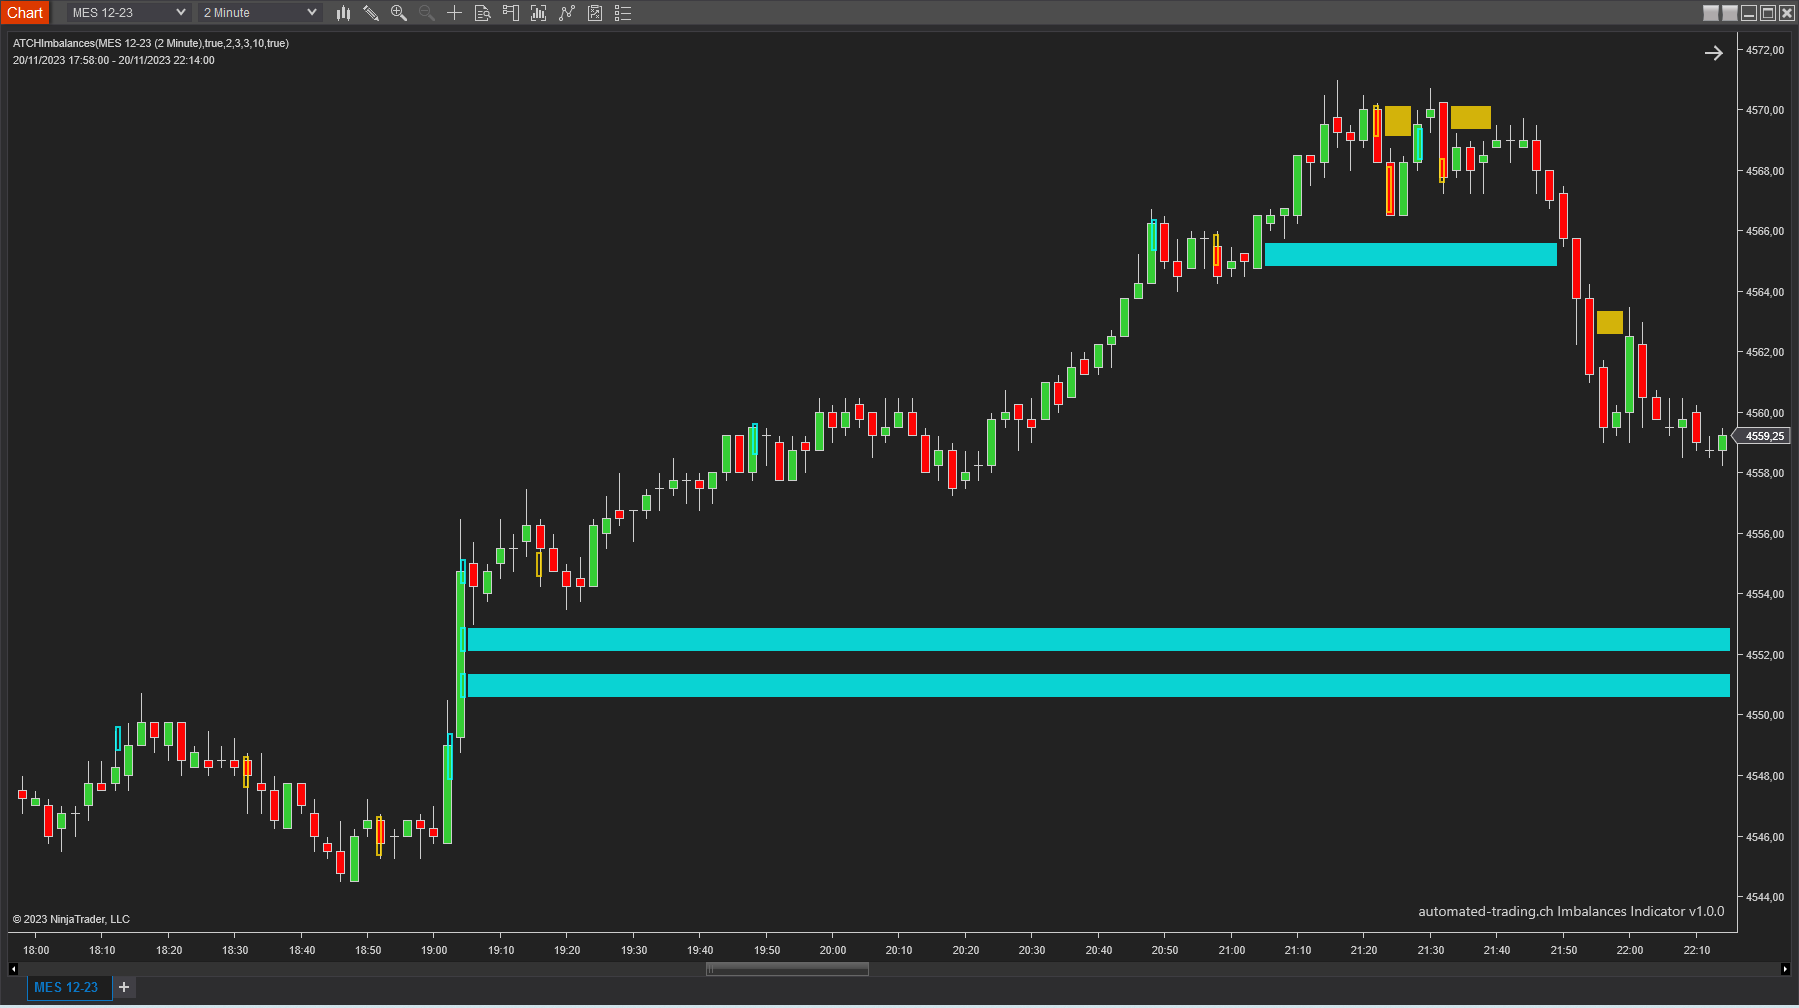
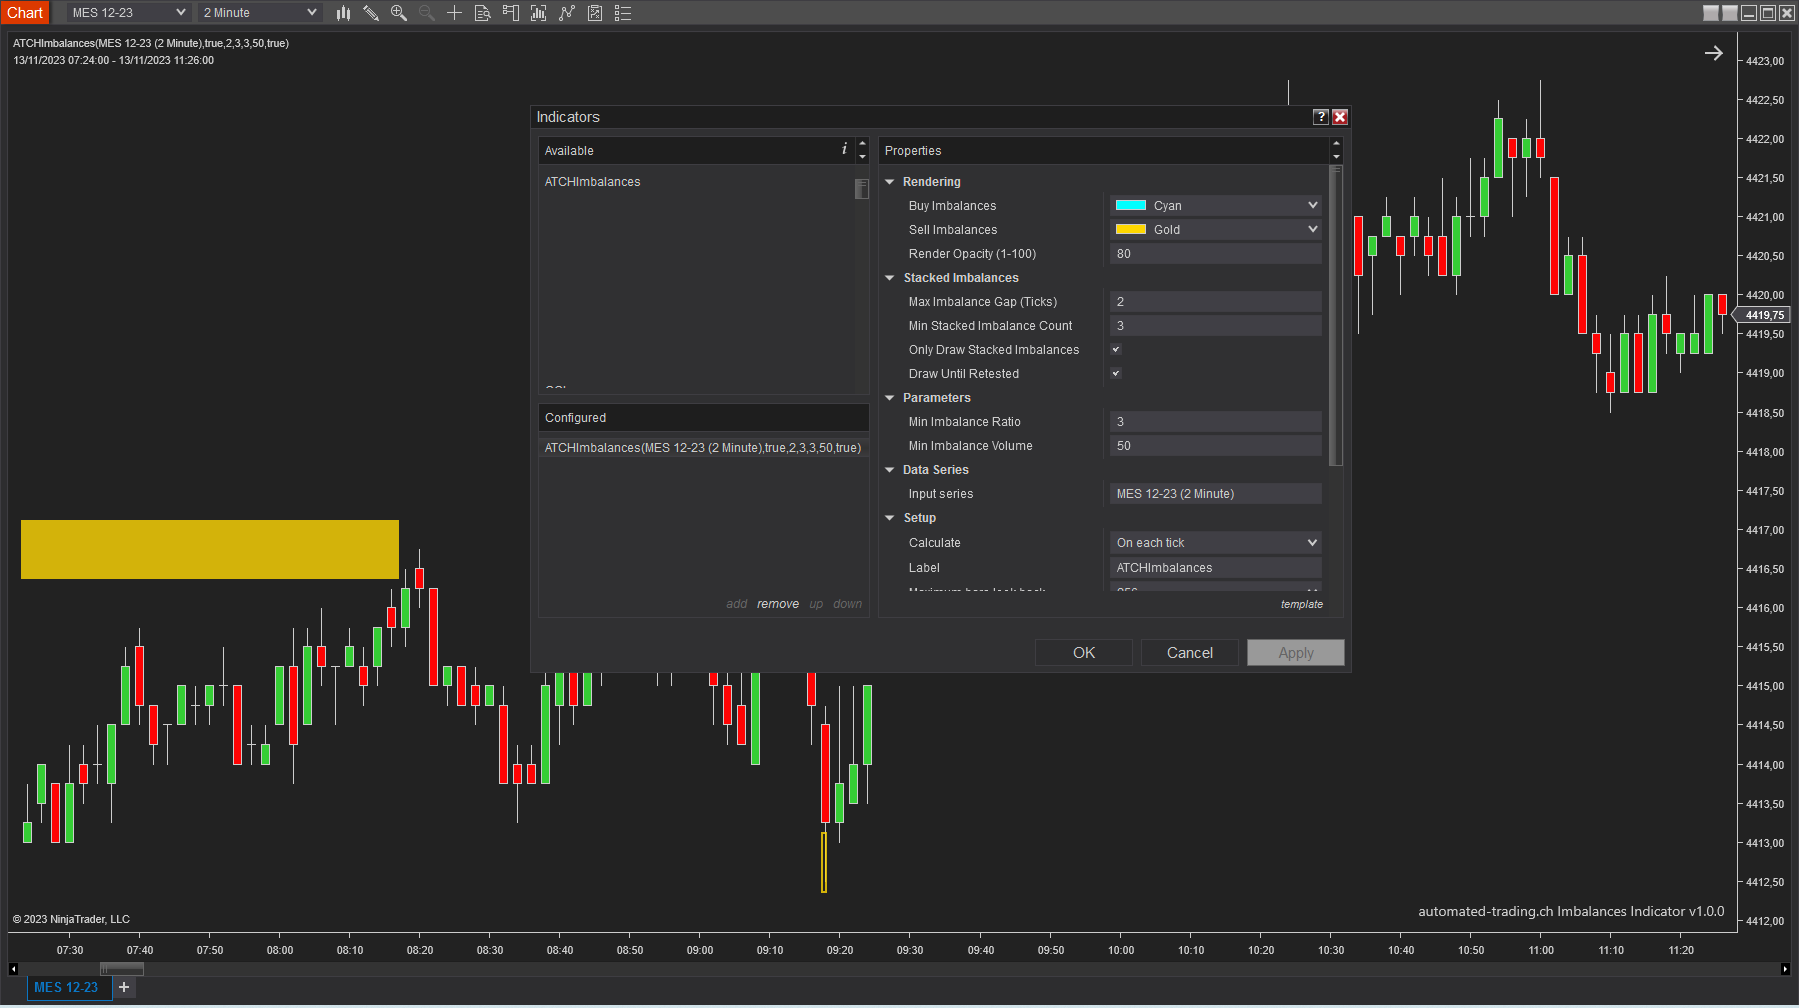
The indicator can also be added to a candlestick chart and it will display rectangles on price levels that have diagonal imbalances
The colors used here are Cyan for buy imbalances (ask side) and Gold for sell imbalances (bid side)
When the parameter Only Draw Stacked Imbalances is enabled this will filter out imbalances that are not stacked
In the below example a rectanlge is drawn on a sell stacked imbalance. This can be a signal of agressive sellers stepping in and a signal to enter a trade short
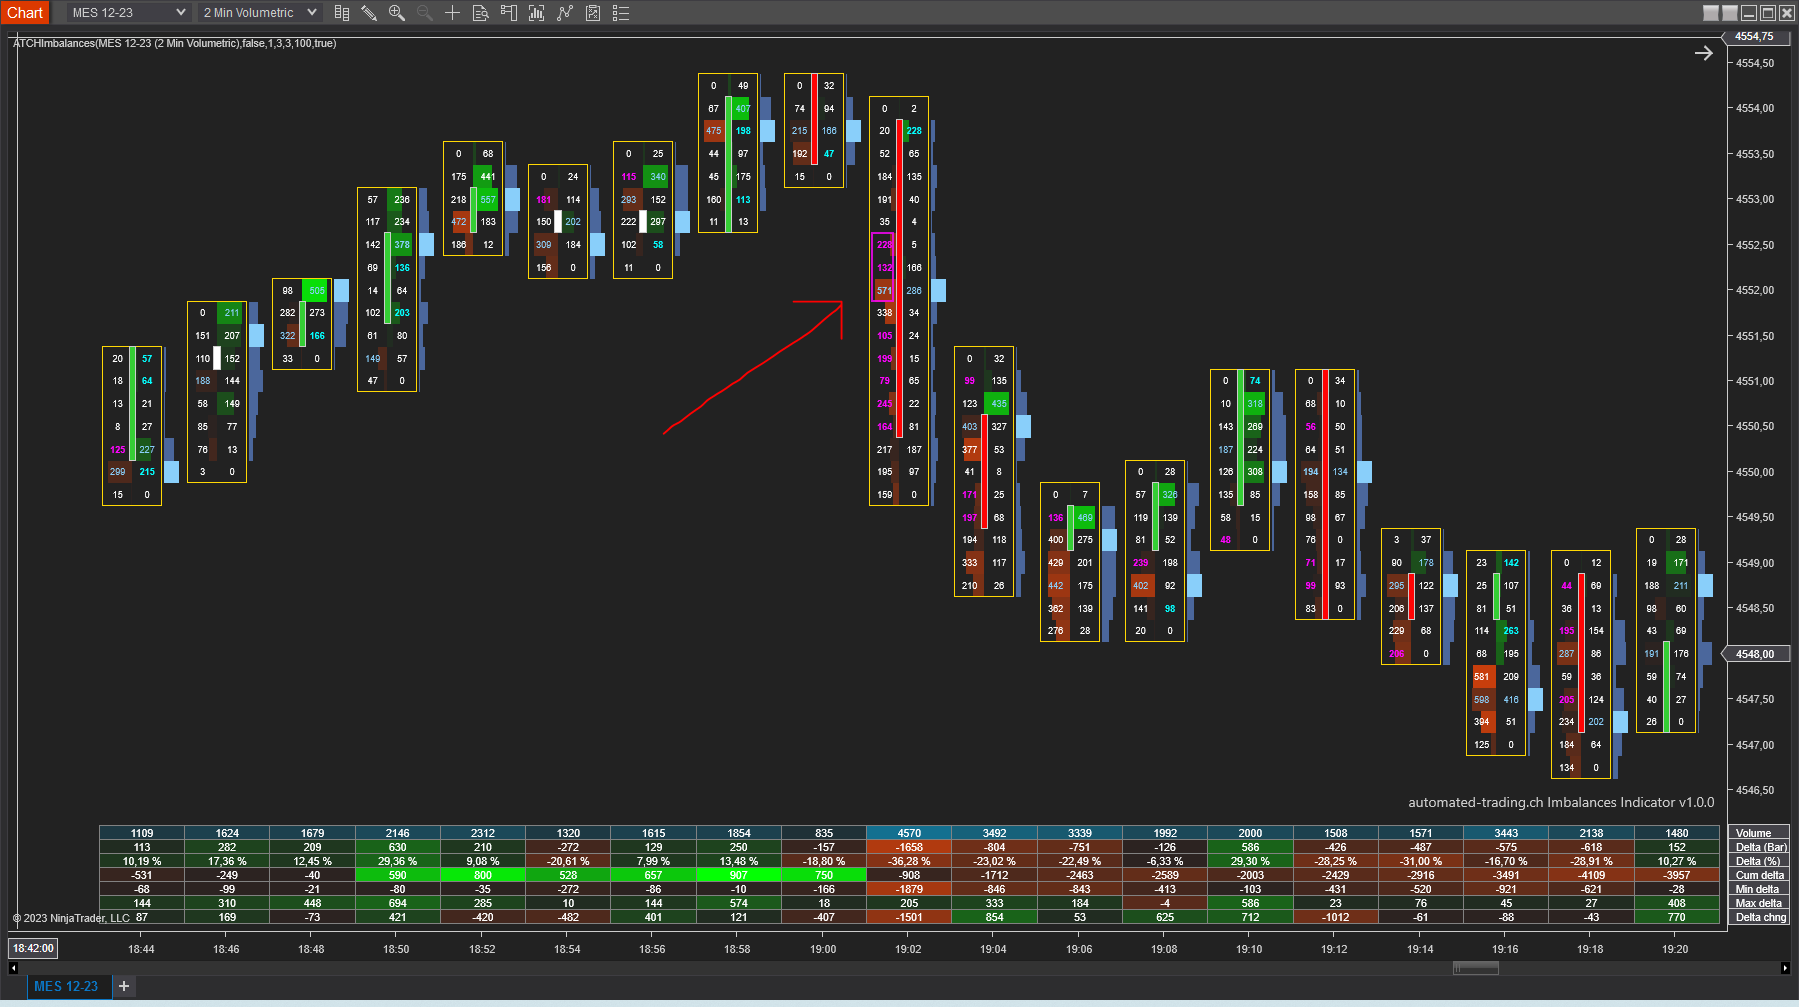
In this example buy stacked imbalances are colored in Cyan (on the ask side), sell stacked imbalances are colored in Gold (on the bid side).
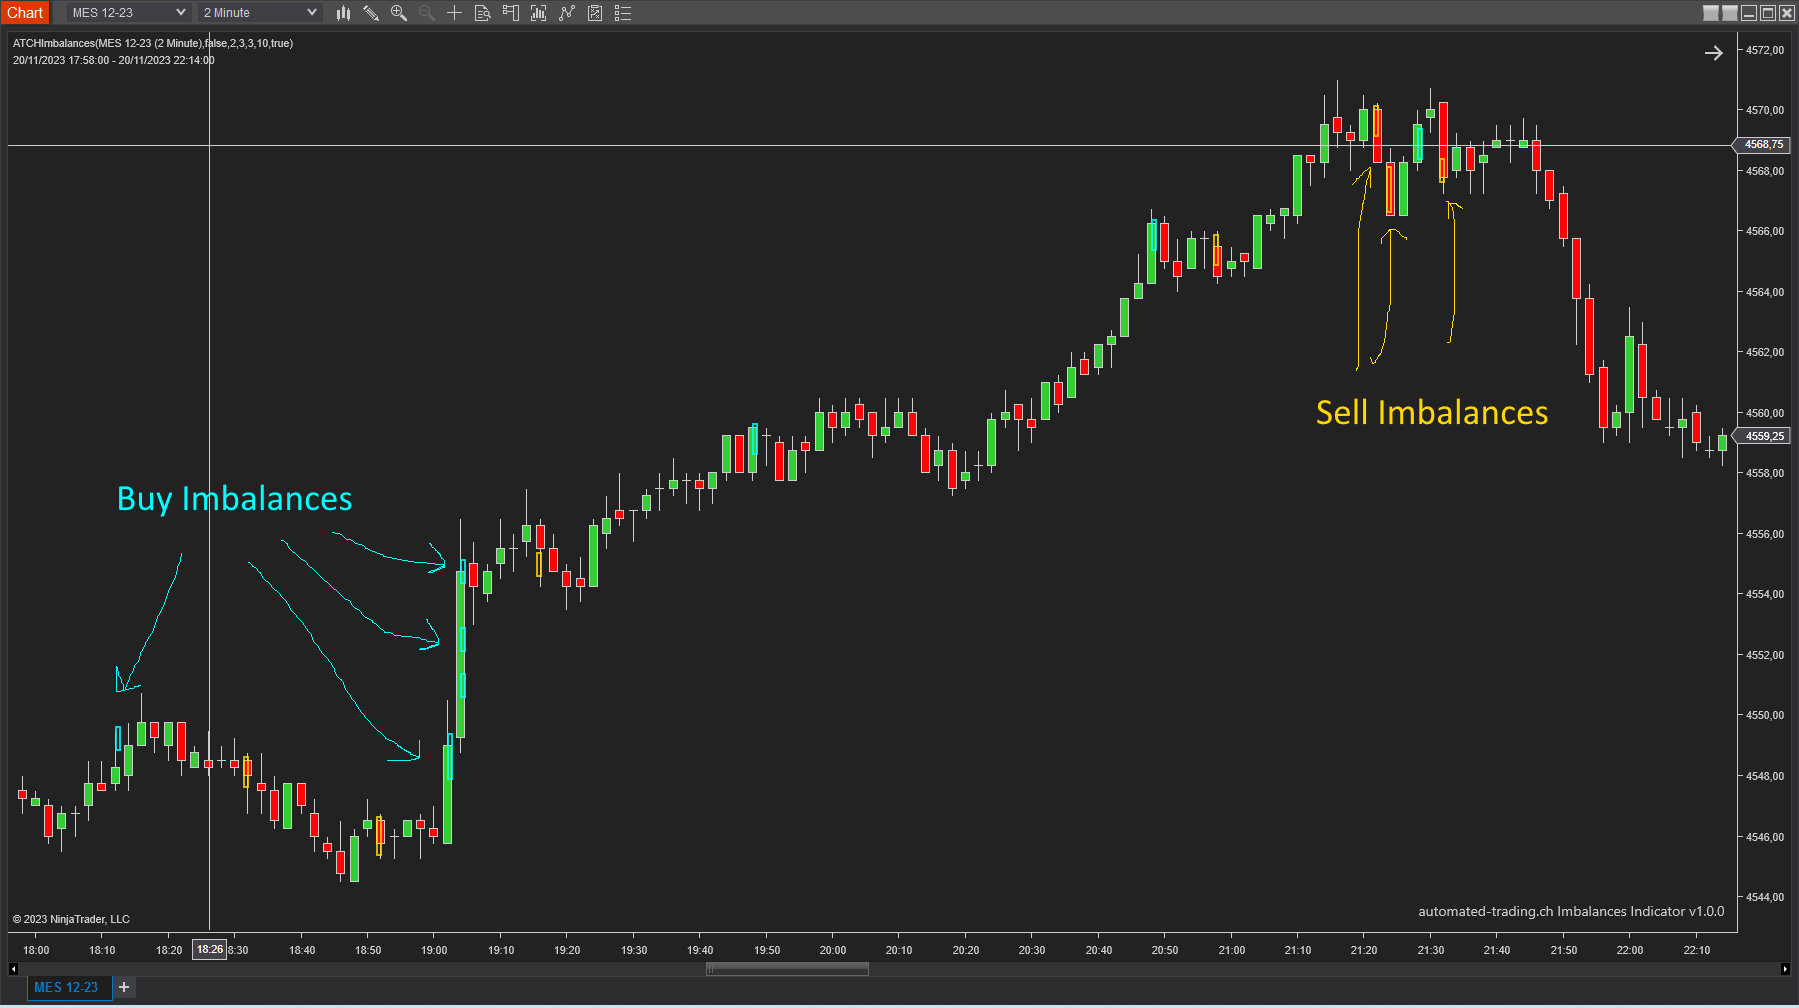
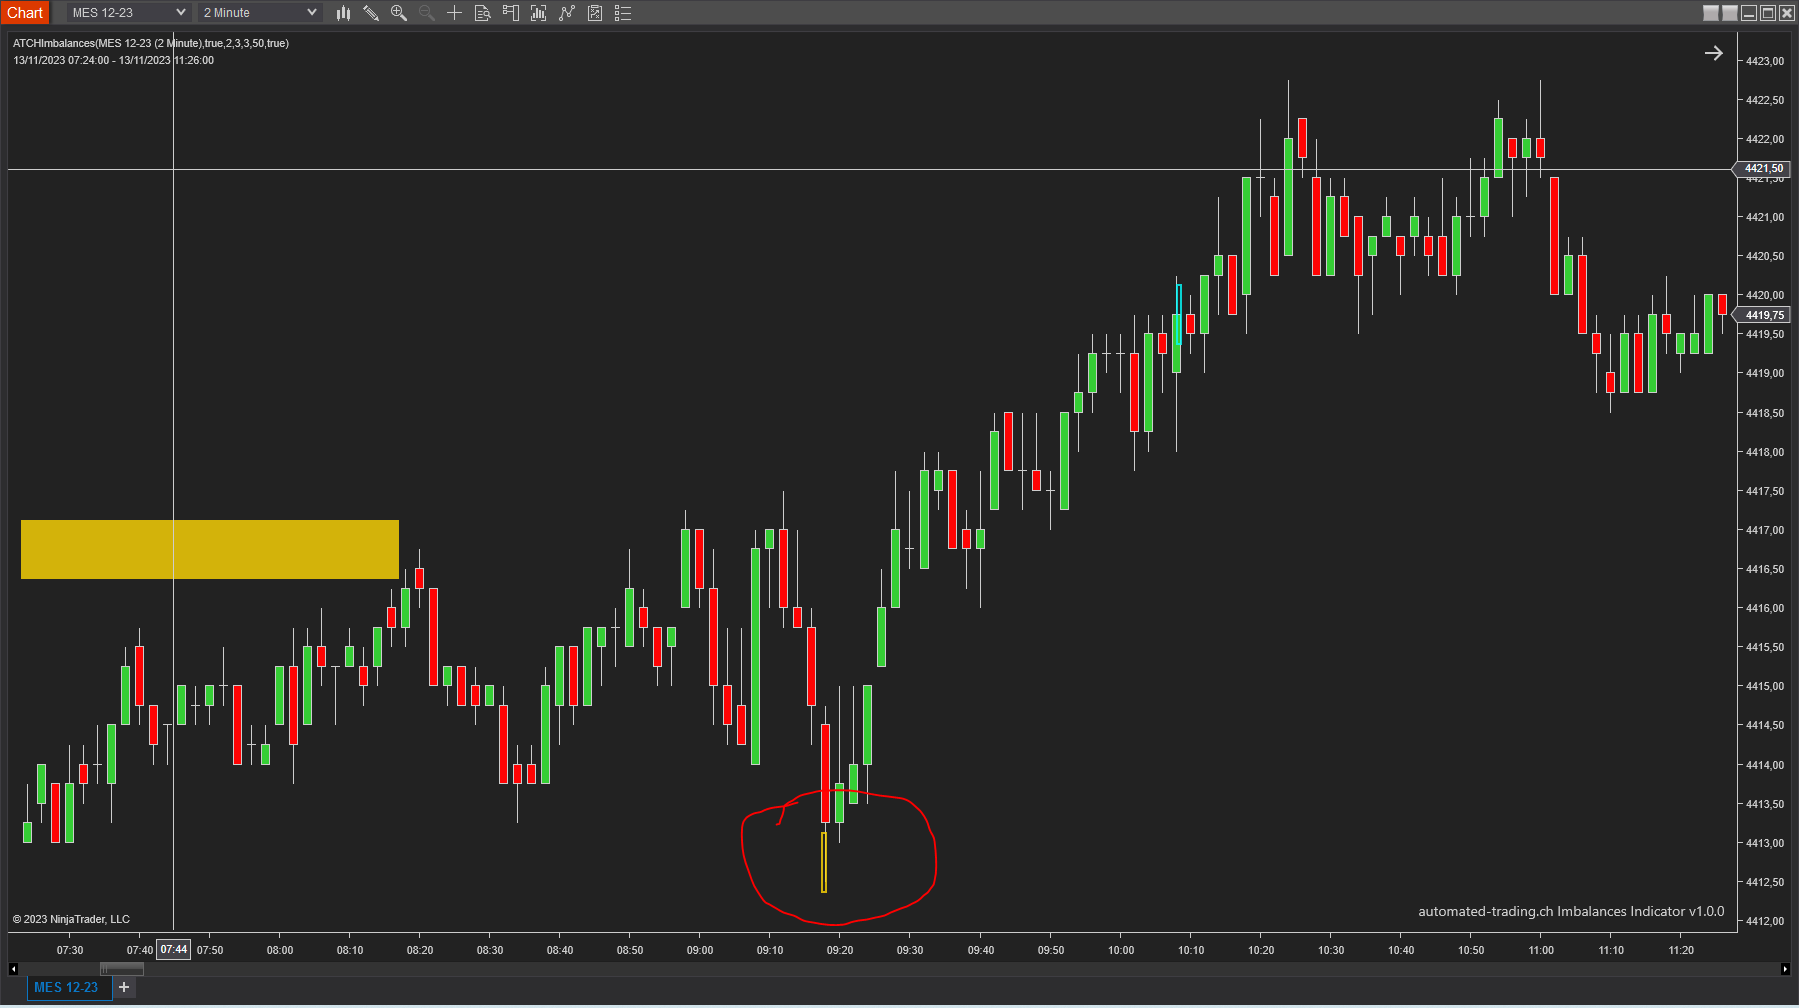
In the example below, some stacked sell imbalances are observed and then the price reversed to retest the zone defined by the stacked imbalances zone.
In this example, buy stacked imbalances are colored in Cyan (on the ask side), sell stacked imbalances are colored in Gold (on the bid side).
In the example below you can see a stacked sell imbalance being trapped before the market reverses long. There was a strong aggressive volume by sellers to push the market down, but eventually the market reverses on the long side.
Features
The imbalances indicator has a set of unique features
- Free. The indicator is completely free to use.
- Can be used on Footprint charts or regular candlestick charts (time based or price based)
- Highly customizable and can be adapted to wide range of instruments
- Can be run on Historical Data (TickReplay should be enabled)
- Can expand rendering of stacked imbalances zones until retested by price, which can be used as signal to enter a trade
Parameters
We always try to keep the parameters to minimum.
| License | |
| License | This is the free license key you get when you create an account on automated-trading.ch. After creating an account, copy your license key from the billing page. You need to set this parameter only once per month, once the license key is validated it will be remembered for the rest of the billing cycle. |
| General | |
| Min Imbalance Volume | This parameter sets the minimum volume value on the strong side (bid/ask) to consider an imbalance |
| Min Imbalance Ratio | This parameter sets the minimum ratio between the diagonal bid/ask volumes to consider an imbalance |
| Stacked Imbalances | |
| Max Imbalance Gap (Ticks) | This parameter sets a gap tolerance between stacked imbalance levels. For example, multiple imbalances that are not perfectly stacked (having a number of tick gaps between them) will be considered a cluster of stacked imbalances if the this parameter is higher than one |
| Min Stacked Imbalance Count | This parameter sets the minimum number of imbalances in a cluster of stacked imbalances, generally this should be 3 or more |
| Only Draw Stacked Imbalances | This parameter will restrict drawing to stacked imbalances. No single imbalances will be drawn |
| Draw Until Retested | This parameter expand the drawing of stacked imbalances until the price retest them |
| Stop Extending @ New Day | This parameter will make the zone drawing stop from extending into a new day. |
| Mitigation Method |
When price hits the imbalances extension zone, after its formation, it is said to be "mitigated" and it stops from further extending. This parameter allows to chose which
mitigation method is used to set whether a zone is considered mitigated by the price:
|
| Play Sound | This parameter will enable playing and alert sound when a price bar closes with a stacked imbalance |
| Play Sound File | This parameter will set the file name to be played on sound alert. This can be set to any .wav file on your computer |
| Rendering | |
| Buy Imbalances | The Color used to draw Buy side (Ask) Imbalances |
| Sell Imbalances | The Color used to draw Sell side (Bid) Imbalances |
| Render Opacity (1-100) | The opacity to render imbalances and retest zones |
Download & Installation Instructions
The indicator can be downloaded for free. To download and install the indicator follow the instructions below
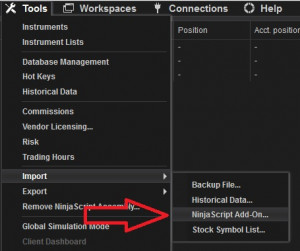
- Click on the below download button to download the Imbalances Indicator file
- Import the downloaded .zip file into NinjaTrader using the import NinjaScript menu item
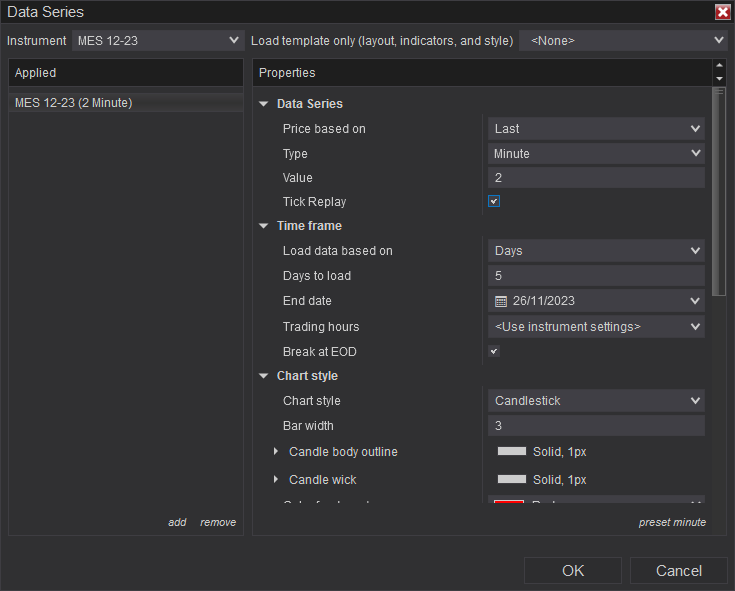
- Next, open a new chart window
- On the new chart settings, you can check or not Tick Replay check box
- The Indicator works seamlessly with or without Tick Replay
- After installing the indicator and opening a new Chart window you should add the indicator to the chart. Right-click on the chart and click on Indicators...
- Copy/Paste your license key that you can find on the Billing page into the license parameter
- After adding the indicator to the chart, the indiactor will be run on Historical data loaded in the chart.
- After that, the indicator is added with success and will continue to run on live market data
Frequantly Asked Questions
General
Yes, If you have an idea that you believe can improve this indicator, I will be more then happy to hear from you. Please use the contact page to send me a message
No, the source code of the indicator is protected for copyright reasons
No, this indicator only do rendering and doesn't provide data that can be used from within a strategy. Check out our other strategies for an imbalances based strategy
Yes you can use this indicator without TickReplay, but bare in mind that in this case the indicator will not detect imbalances on historical candles. The indicator will start detecting imbalances only on real time volume and price data
Release Notes
- Tick Replay is no more needed
- Added "Stop Extending @ New Day"
- Added "Mitigation Method"
- Added License check capabilities
- Added Play Sound and Play Sound File parameters
- First Release of the indicator
User Comments & Feedback
You can find feedback of our users and ask questions about this strategy by joining our discord community by following this invite link or clicking on the Discord logo image. Joining is completely free
![]()