Summary
The Swing Breakout Sequence (SBS) Strategy is a Premium mechanical strategy for the NinjaTrader 8 platform inspired from Stoic Trader's trading model presented by Stoic himself here : Link to youtube video The strategy can be used to pass propfirms evaluation challenges
We highly recommend joining our discord community by following this invite link
![]()
Index
Prequisites
To properly use this strategy you should have available the following prequisites
- NinjaTrader 8. with any license type . Order Flow is not needed to run this strategyClick here to download
- automated-trading.ch Account with Premium Subscription
Getting Started Video
Important Disclaimer
We strongly recommend that you never run your algorithmic trading systems on your hard-earned real money. You should always minimize your risk and run your strategies on trader funding programs so that the maximum amount your risk to lose is the monthly subscription fee you pay those programs.
Here are the trader funding programs that we recommend using, and that we use to run the SBS strategy on:
- Lucid Trading
- Funded Next
- Tradeify
- Apex Trader Funding
- Want to know more about propfirms and how to chose the best one ? Click Here
Entry Setup Criteria
This strategy has one entry setup that is based on the Swing Breakout Sequence algorithme. You can read more about this on the Swing Breakout indicator here Swing Breakout Sequence Indicator
To resume, the SBS entry model is a high probability entry model with a defined risk reward ratio. This entry model is based on a sequence of 5 swing sequence as illustrated on the image below
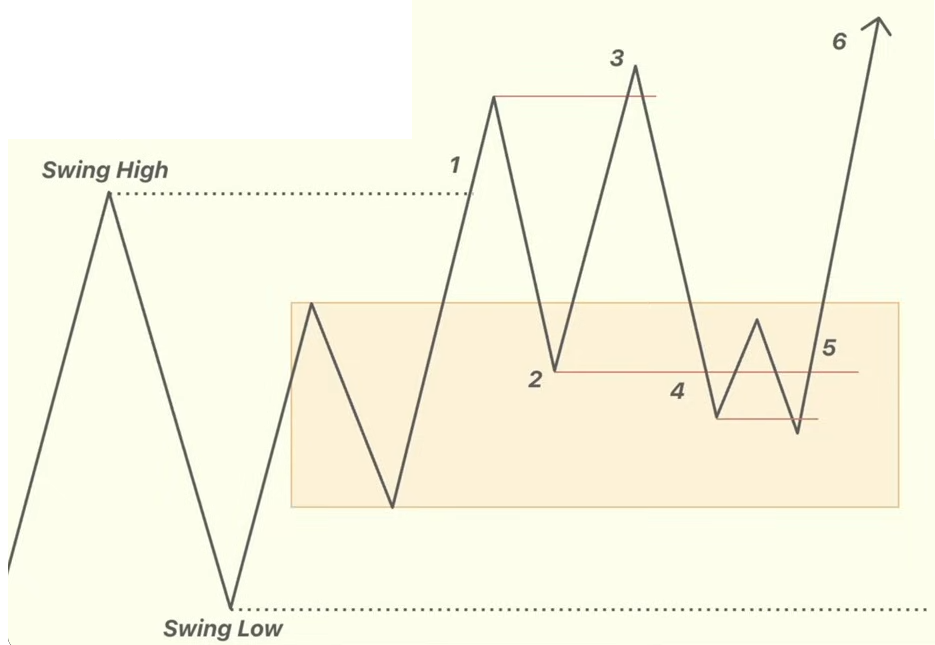
Here is the algorithm for an entry setup:
- The first step into an entry setup, is the full detection of a Swing Breakout Sequence. The Swing Breakout Sequence (SBS) should be fully formed of 5 swings respecting the pattern defined on the image above for a bullish entry, and exactly the inverse pattern for a bearish entry. But having the 5 swings is not a sufficient criteria for a valid (SBS). The final criteria for a valid (SBS) is that the price breakout from one of the swings composing the (SBS). Since the 5th swing is the lowest swing for a bullish (SBS) and the highest swing for a bearish (SBS), the strategy (similar to the indicator) offers the possiblity to chose which swing will be the trigger for a breakout and thus validating the (SBS). According to my backtests, I found that the 1st swing in the sequence is the best one.
- If the price close outside the range defined by the prior swings, the (SBS) will be invalidated and disposed and it will not be displayed
- Notice that the (SBS) is not drawn in real time during swing formation. Because if it was, you would see many (SBS) being drawn then invalidated and removed from the chart in realtime which will create visual confusion. Only valid ones are drawn after being validated by a breakout.
- Once an (SBS) is validated, the algoritm will calculate a ratio on the (SBS). To define the ratio let's define two important levels:
- The target level: This is defined by the 3rd swing
- The stop level: This is lowest (for bullish), and highest (for bearish) swing in the sequence. This can be either the 5th swing or the prior lowest low swing for (bullish) or the prior highest high (for bearish)
Chart Examples
So let's look at some examples on the chart:
These examples are not intended to show that the strategy generates profit. I have intentionally handpicked profitable trades to avoid confusion and to show the best case scenarios where the entry setups work well. If you run the strategy on your side, you will see that many of those same entry setups will lead to losing trades. This is the reality of trading. Your goal should be expected profitability on the long run even though some trades are in loss.
Long entry on MNQ 30 seconds
In this example, we are on MNQ on the 30 seconds timeframe. You can see the swing sequence forming a bullish pattern with the two higher and lower prior swings drawn in Gold dashed lines. The green bar with the entry arrow on 21h05 has broken the 1st Swing, that bar triggered the entry signal on its closing. The stoploss was set to the minimum value between the lower prior swing and the 5th swing in the sequence which is the lower prior swing level on 19999.25. with a win:loss ratio of 1 the take profit was hit several bars later
Long Entry skipped due to Ratio
This example shows a case where an entry was skipped due to Ratio filter. As you can see all the conditions for an entry occured. Then the algo calculated the Ratio that caracterizes the (SBS). The ratio in this case was very small because the entry price was very close to the 3rd Swing and very far from the stoploss level. The minimum ratio value set on this example is equal to "1" and thus the algo dismissed this entry. If the minimum ratio was set to lets say "0" or "0.1" the entry would have been taken.
Short entry on MNQ 30 seconds
In this example, we are on MNQ on the 30 seconds timeframe. You can see the swing sequence forming a bearish pattern with the two higher and lower prior swings drawn in Gold dashed lines. The red bar with the entry arrow on 09h39 has broken the 1st Swing, that bar triggered the entry signal on its closing. The stoploss was set to the maximum value between the higher prior swing and the 5th swing in the sequence which is the higher prior swing level on 19976.00 with a win:loss ratio of 1 the take profit was hit several bars later
Features
The Swing Breakout Sequence strategy has a set of unique features:
- Robust In-house implementation of the Swing Breakout Sequence algorithm
- No pending orders are placed: only market orders
- Full-auto strategy that can be scaled into multiple instances
- Precise backtesting capabilities following NinjaTrader official best practices to obtain precise entry/exit backtesting on tick level
- Robust In-house Order management library. Resistant to connection loss and works seamlessly on Rithmic accounts or NinjaTader brokerage accounts
Here I further explain some of the features of the strategy in more details
Dynamic Quantity and Risk Management
As all our strategies, this strategy implements two methods to set quantity for open positions.
- Fixed Quantity: This method will use the same quantity value for each position. If the stoploss is variable between positions (by using a dynamic stop loss value), The win/loss will be also variable between positions
- Dynamic Risk Adjusted Quantity: This method will calculate quantity of each position based on multiple factors:
- The stoploss of the position
- The maximum risk (in $ currency value) allowed for a position to take
- The maximum quantity allowed for a position to take
Position Management
As all our strategies, this strategy implements mutiple position management methods :
- ATM Strategy:If you wish to delegate the position management to your own ATM strategy, this is possible by selecting an ATM strategy of your choice from the drop down box
- Dollar Cost Averaging:This method will manage the position by increasing the quantity of the position if the price goes into the losing side. By doing that the strategy aims to bring the average price of the position closed to the current price and close the position on breakeven when the price pullbacks
- Trailing Stop:This method will trail the stop loss of the position with each new swing point that gets created on the winning side of the position
- SuperTrend : The strategy is able to use SuperTrend as a management method
Apart from those position management methods, the strategy allows to set the stop loss based on multiple strategies and to set the take profit based on a ratio based method. Check the parameters section for a detailed explanation
Account Management
The strategy implements daily stop-trading triggers based on the Net winning position count, the Net losing position count or when a target realized Net profit is reached. or when a target net loss is reached.
Parameters
We try to keep the parameters to minimum. We only left the most important parameters to be set
| General | |
| Execute Historical Trades | This parameter is very important and should be used carefully. This parameter should be set to true (checked) whenever the strategy runs in Historical, Backtest, or Optimization modes. When running the strategy in Live Real-Time mode this parameter should be set to false (unchecked). |
| Daily TakeProfit Target | The strategy will stop when the daily TakeProfit amount is reached after a position is closed. When set to 0, this parameter is ignored |
| Weekly TakeProfit Target | The strategy will stop when the weekly TakeProfit amount is reached after a position is closed. When set to 0, this parameter is ignored. This target will be reset at each new week start |
| Daily StopLoss Limit | The strategy will stop when the daily StopLoss amount is reached after a position is closed. The value of this parameter is positive. For example if the value is set to 300, the strategy will stop when the Realized PnL is lower or equal to -300$. When set to 0, this parameter is ignored |
| Stop @ Winning Count | This will make the strategy stop trading if the net count of winning trades for the day is equal to the value of this parameter. This parameter is ignored if equal to 0 |
| Stop @ Losing Count | This will make the strategy stop trading if the net count of losing trades for the day is equal to the value of this parameter. This parameter is ignored if equal to 0 |
| Execute on Different Instrument | The parameter will enable executing trades on another instrument than the one on the active chart. This can be useful if you sant to run the strategy logic on Minis and execute on Micros to better manage the risk by opening the trades on Micros. Notice that if you enable this parameter all the risk calculation done by the strategy will be made on the execution instrument. |
| Execution Instrument | The parameter will let you chose from a list of Micros available on your NinjaTrader connection, the instrument on which trades will be executed. notice that historical trades and live trades will Not be displayed on the Chart in this case. |
| Order Label | The parameter will let you set a Label that will be suffixed to all positions sent to the broker. This is useful in case you want the positions sent to the broker to have a specific value to differentiate them from positions of other people using the same strategy |
| Swing Breakout Sequence | |
| Show Sequence Numbers | Enable/Disable drawing of numbers labels below/above each swing sequence point |
| Show Sequence Lines | Enable/Disable drawing of lines connecting the swing sequence points |
| Render Opacity (1-100) | The opacity to render objects on the chart. I personally prefer the value of 20 for this parameter |
| Swings Period | Swings are higher lows,higher highs, lower highs and lower lows. After each price bar close, a swing can be detected. But just after that, the next bar can cancel the swing at the previous bar by creating a new swing of the same type. Or this can happen on the second bar, or the third, etc... The swing period sets how many bars is enough to seperate two swings of the same type. The more you increase this parameter, the more you decrease the number of swings overall. The more you decrease this parameter, the more you increase the number of overall swings. I personally use the value of 3 or 4 for this parameter. |
| Invalidation Method |
|
| Breakout Swing |
|
| Breakout Fibo Level | This parameter is only used if the Breakout Swing is selected as Fibonacci Retracement
|
| Min SBS Ratio | This ratio is defined by the distance of potential take profit divided by the stoploss distance at the current price when the SBS is validate meaning at the close of the bar that breaks the "Breakout Swing". This ratio reflects the skewness of the (SBS). The more this ratio is close to 1 the less the SBS is skewed. I have found the value of 0.9 to be optimal |
| Min SBS Bars Count | This parameter can be used as a filter to set the minimum number of bars that composes the SBS structure. This can be useful to filter out small SBS structures that don't occupy a sufficient number of bars and are insignificants |
| Max SBS Bars Count | This parameter can be used to filter out SBS structures that are too big in numbe of bars. In general, SBS strucutres that occupy a very big number of bars don't generate profitable signals |
| Max SBS Height points | This parameter can be used to filter out SBS structures that are too big in height in points. |
| Entry Setup | |
| Time Zone |
This parameter sets the time zone to be used for setting the Trade Time parameter below. Since futures markets are open and closed based on US market time zone which is EST (US Eastern, New York), this parameter allows you to specifiy trade time interval on another timezone which is your local machine timezone
|
| Trade Time | This parameter is very important and can be delicate in some cases. This parameter is used to specify the time intervals in which the strategy is allowed to place trades. Here are some examples for more clarifications:
|
| Quantity Strategy |
This parameter sets how the quantity should be set for a Trade
|
| Max Qty | This parameter sets the maximum allowed quantity when the Risk Adjusted method is selected. This option is very useful since some propfirms has order quantity limits that can cause the account to be invalidated |
| Invert Entries | This parameter will invert entries from long to short and from short to long. When this parameter is enabled, the strategy will calculated stoploss, take profit and risk with no inversion logic, then at the last step of actually opening the trade, the strategy will invert the trade type. In consequence, the stoploss will be transformed into a take profit and the take profit will will be transformed into a stoploss. And the risk will be inverted so for example, a 2:1 take profit will be transformed into a 1:2 take profit and so the risk will be increased. This should be taken into consideration while enabling this parameter. This inversion can be useful on choppy market regimes where the original breakout logic does not hold with price action |
| Long/Short Entry Mode |
This parameter is useful if you already have a directional daily bias and want to restrict trading to a specific direction long or short
|
| SuperTrend Entry Filter | This parameter will enable/disable using the SuperTrend indicator as an entry filter. When this is enabled, Long trades are allowed to enter only when the SuperTrend is in bullish mode. Inversly, it allows short trades to enter only when the SuperTrend indicator is in bearish mode |
| SMAs Entry Filter | This parameter will enable/disable using two Simple Moving Averages as entry filter. When this filter is enabled the SBS sequence should generate a breakout above/below the two moving averages |
| SMA Slow Period | The period of the first Slow SMA |
| SMA Fast Period | The period of the first Fast SMA |
| Entry Mode | This parameter sets the entry mode after a valid SBS sequence is detected
|
| FVG Candle Filter | This parameter sets a filter for the FVG detection :
|
| Min. Gap (ticks) | This parameter sets the minimum distance in ticks between the wicks of the Fair Value Gap to be valid. The more you increase this value, the fewer FVGs will be detected. Inversly, the more you decrease this value, the more it increases the number of detected FVGs |
| Order Qty | This parameter is only used if the Quantity Strategy is set to Fixed. This parameter sets a fixed quantity of each trade. In the case of increasing orders quantity executed by the order management mechansim, this parameter is also used for each increase in quantity. Generally, We would use the values 1 or 2 for this parameter |
| Order Management | |
| Order Management Strategy |
|
| ATM Strategy Template Name |
This parameter is available when the ATM Strategy order management method is selected. This parameter specifies which ATM strategy to use. As in the image example above, the value of this parameter should be the template name of your custom ATM strategy. In the example is should be equal to template1 off course you can chose another name, but the most important thing is that the parameter value should correspond to an existing "ATM strategy template" otherwise no position will be opened |
| On Opposite Signal |
|
| Enable Price Breakeven | This parameter will enable/disable breakeven mechanism based on price |
| Breakeven Price Strategy | This parameter sets how the price based breakeven should be calculated
|
| Breakeven Price Trigger | This parameter is available if Price based Breakeven is enabled This parameter sets the trigger value that needs to be reached in order to set the stoploss of the current position to breakeven |
| Enable Time Breakeven | This parameter will enable/disable breakeven mechanism based on time in minutes |
| Breakeven Time Trigger | This parameter is available if Time based Breakeven is enabled This parameter sets the trigger value in minutes that needs to be reached in order to set the stoploss of the current position to breakeven |
| StopLoss Strategy |
|
| TakeProfit Strategy |
|
| Scale out % Qty at % Target | This option will enable a scaling out mechanism that consists in closing a percentage of the position quantity when the price hits a certain percentage of the the profit target. The value calculated is rounded to the lower value if the percentage value calculated is fractional. For example, if the position is a 5 quantity positions, and the quantity percentage of this parameter is set to 50%, the quantity closed will be 2 (lower end of 2.5) |
| Scale out at % Target | This parameter sets the percentage of the profit target that will trigger the scaling out mechanism |
| Scale out % Qty | This parameter sets the percentage of the quantity that will be closed during the scaling out mechanism |
| Take Profit Currency | This sets the take profit in dollars for the open position. If you use the Fixed Currency Value as a take profit strategy, the value of this parameter will be used. If not, make sure to set this parameter to a high value to not interfer with other ratio based strategies |
| Stop Loss Points | This parameter is available if the Stop Loss strategy is set to Points |
| Target Risk Per Trade ($) | This sets the max risk in dollars for one position.
|
| Max Allowed Risk Per ($) |
|
| Stoploss offset Points | This parameter will add an offset of points to the calculated stoploss level. This offset will be used when calculating Risk per trade |
| Take Profit Points | This parameter is available if the Take Profit strategy is set to Points |
| Super Trend | |
| SuperTrend Mode |
|
| Period | This sets the supertrend period |
| Multiplier | This sets the Supertrend multiplier. The bigger this parameter the wider the superstrend bands |
| Moving Avg. Type | This selectes the Moving Average type for Supertrend |
| Smooth | This sets the smoothing period of the supertrend |
| SuperTrend Close Only Winning | This parameter sets if the Supertrend used as an OrderManagement method will close a position only if it is in Profit. When the SuperTrend is used as an Order Management method, trades can be opened and immediately be below or above supertrend which will make those trades be closed immediately. This parameter will make this situation avoided |
| Trailing Stop Parameters | |
| Trailing Stop Strategy | When the Classic Trail Stop method is selected, this parameter let you chose on which basis the trailing will be calculated
|
| Trailing Stop Trigger | When the Classic Trail Stop method is selected, this parameter sets the trigger (in Points or in Ratio) |
| Trail Amount | When the Classic Trail Stop method is selected, this parameter sets the amount (in Points or in Ratio) to be trailed when the trigger is hit |
| DCA (Grid) Parameters | |
| Breakeven Profit Shift | When the DCA method is selected as a position management method, this parameter will modify the definition of a breakeven and adds a bit of profit to it. This is useful to cover the cost of commissions when closing the grid in breakeven |
| Grid Size to Breakeven | When the DCA method is selected as a position management method, this parameter will set the number of order increases required to consider closing the position in breakeven |
| Min Grid Gap (Point) | When the DCA method is selected as a position management method, this parameter defines a minimum gap disstance in points between two orders |
| Bar Close Trigger | When the DCA method is selected as a position management method, this parameter will make grid orders open on bar close in the direction of the trade |
| Command Buttons | |
| The strategy allows to manually execute some commands in case you want to manually intervene. The commands buttons are added to the Chart Trader panel, make sure to show it on your active chart | |
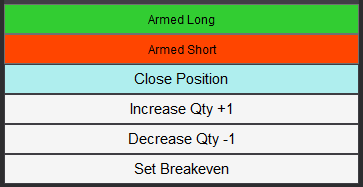 | |
| Arm/Disarm Buttons | The Arm Long/Disabled Long and Arm Short/Disabled Short buttons can manually activate or deactivate entering trades long or short. By default those two toggle buttons are enabled meaning the strategy is armed to enter both long and short trades. Toggling the button to the disable will restrain the strategy to enter a trade in the disabled direction. This can be useful if you have a directional bias or conviction about the direction of the market |
| Close Position Button | The Close position button will immediately flatten the position on the active instrument on the active Chart. This can be useful if you want to exit a trade without having to affect the strategy or restart it. After closing the position, the strategy will continue to function normally and look for new trades to take |
| Increase Qty Button | The increase Qty button allows to increase the quantity of the current active position. The increase value is defined by the parameter Order Qty. This can be useful if you want to manually dollar cost average the position or to double the quantity of the position after a confirmation signal on the winning side of the trade |
| Set Breakeven Button | The button will set the stoploss of the open position to breakeven level if the current stoploss price is lower than breakeven price for long entries and higher than breakeven price for bearish entries. |
Backtesting and Preferred Settings
Here I will try to periodically list backtests with different risk appetit. But before that here are some remarks regarding backtesting
- Past results are not guarantee of future results. All backtesting results are for indicative purposes only
- The period on which the backtest was run was not handpicked to show the best results, The backtest period is the month prior to the first release of this strategy
- Commissions are included in the backtests to get as realistic results as possible. The commission schema used is NinjaTrade Lifetime license commissions schema
- At automated-trading.ch we run very precise backtests due to the following 2 factors
- We are following the NinjaTrader official guide on how to achieve precise intrabar granularity backtesting by using additional tick level DataSeries See here for more info
- We are only using Market Orders instead of Pending Orders, in both real-time and becktest modes.
- Instrument MES
- Timeframe 1 Minute
- Period From 04 March 2024 to 07 March 2025
- Run Mode Backtest
- Total Profit 11 443 $
- Max Drawdown (-3 180) $
- Run Release Version 2.0.1.0
Righ-Click on the button -> Save Link As... into NinjaTrader templates folder ...\Documents\NinjaTrader 8\templates\Strategy\ATCHSwingBreakoutSequenceStrategy
This defensive template on MNQ runs on the 30 Seconds timeframe and is very selective on entry setups time. This parameter template doesn't trade everyday. It has a daily loss limit of 250$ and an unlimited profit daily potential. It only trades between (EST) 4 AM to 5 AM and between 10 AM and 11AM. It targets 250$ risk per trade. The profit can be adjusted and increased by increasing the Daily limit loss, the Target Risk per trade and the maximum quantity parameter. See below for an aggressive version of this template. This template is adapted for a 25k type trader funded account where the maximum drawdown should be kept at a minimum
- Instrument MNQ
- Timeframe 30 Seconds
- Period From 13 March 2024 to 28 March 2025
- Run Mode Backtest
- Total Profit 12 264 $
- Max Drawdown (-2 879) $
- Run Release Version 2.0.1.0
Righ-Click on the button -> Save Link As... into NinjaTrader templates folder ...\Documents\NinjaTrader 8\templates\Strategy\ATCHSwingBreakoutSequenceStrategy
The above defensive template on MNQ has been running on an Apex Live Trader Funding account. The strategy succeeded the account validation challenge on 14 December 2024. You can see the detailed analysis and summary of the live Apex account trades and performance below
- Instrument MNQ
- Timeframe 30 Seconds
- Period From 11 November 2024 to 13 December 2025
- Run Mode Live Trader Funding
- Total Profit 1 962 $
- Max Drawdown (-803) $
- Run Release Version 2.0.1.0
This aggressive template on MNQ runs on the 30 Seconds timeframe and is very selective on entry setups time. This parameter template doesn't trade everyday. It has a daily loss limit of 750$ and an unlimited profit daily potential. It only trades between (EST) 4 AM to 5 AM and between 10 AM and 11AM. It targets 750$ risk per trade. This template is adapted for a 150k and up type trader funded account where the maximum drawdown should be kept below 5000$
- Instrument MNQ
- Timeframe 30 Seconds
- Period From 13 March 2024 to 28 March 2025
- Run Mode Backtest
- Total Profit 38 162 $
- Max Drawdown (-7 661) $
- Run Release Version 2.0.1.0
Righ-Click on the button -> Save Link As... into NinjaTrader templates folder ...\Documents\NinjaTrader 8\templates\Strategy\ATCHSwingBreakoutSequenceStrategy
Download & Installation Instructions
At automated-trading.ch you can chose to either purchase monthly subscription to use our premium products, or use our free products without subscribing
In both cases, you need to create an account so you can get a License that you can use for both premium and free products
To obtain the license simply Signup and then get your license on the billing page
This Swing Breakout Sequence strategy is a premium strategy. It can be run on Backtest, Playback and Optimization modes for free. Whereas an active subscription is required to run it on Live mode.
To download and install the strategy follow the instructions below
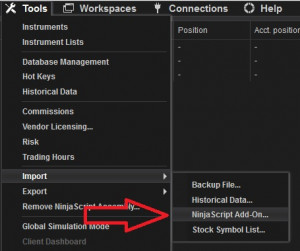
- Click on the below download button to download the (SBS) Strategy file
- Import the downloaded .zip file into NinjaTrader using the import NinjaScript menu item
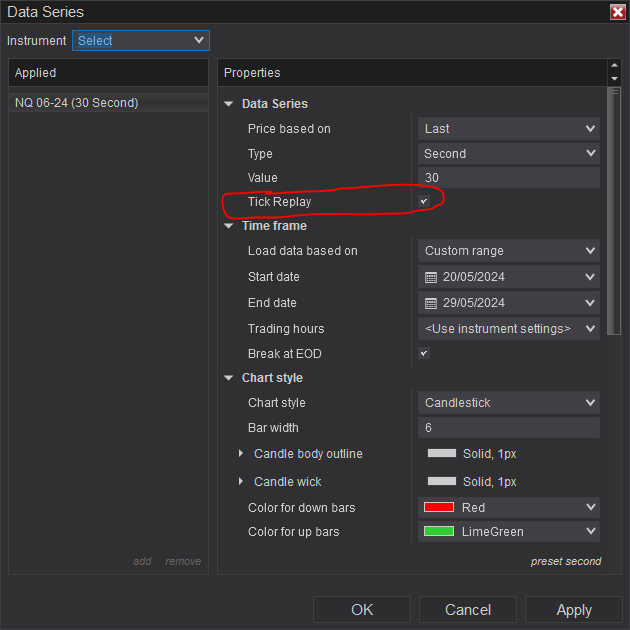
- Next, open a new chart window while making sure the Tick Replay tickbox is checked
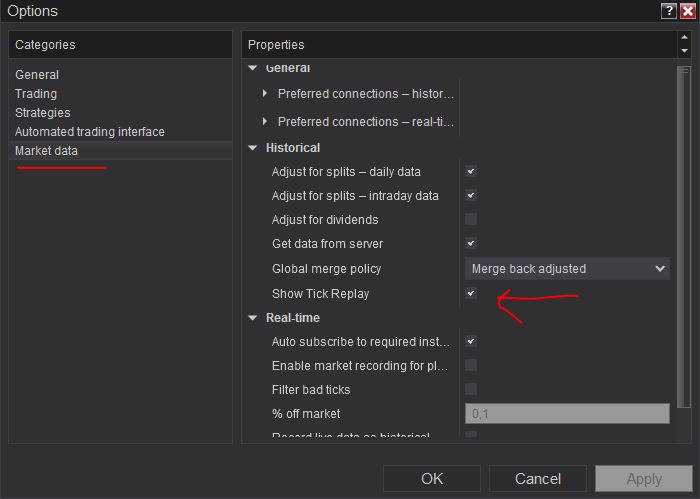
- If you don't see the Tick Replay check box, go to Tools->Options->Market Data and enable Show Tick Replay
- After installing the strategy and opening a new Chart window you should add the strategy to the chart. Right-Click on the chart and Click on
the the "Strategies" Context menu entry. Or you can Ctrl+S on the Chart to open the "Add New Strategy" Dialog window
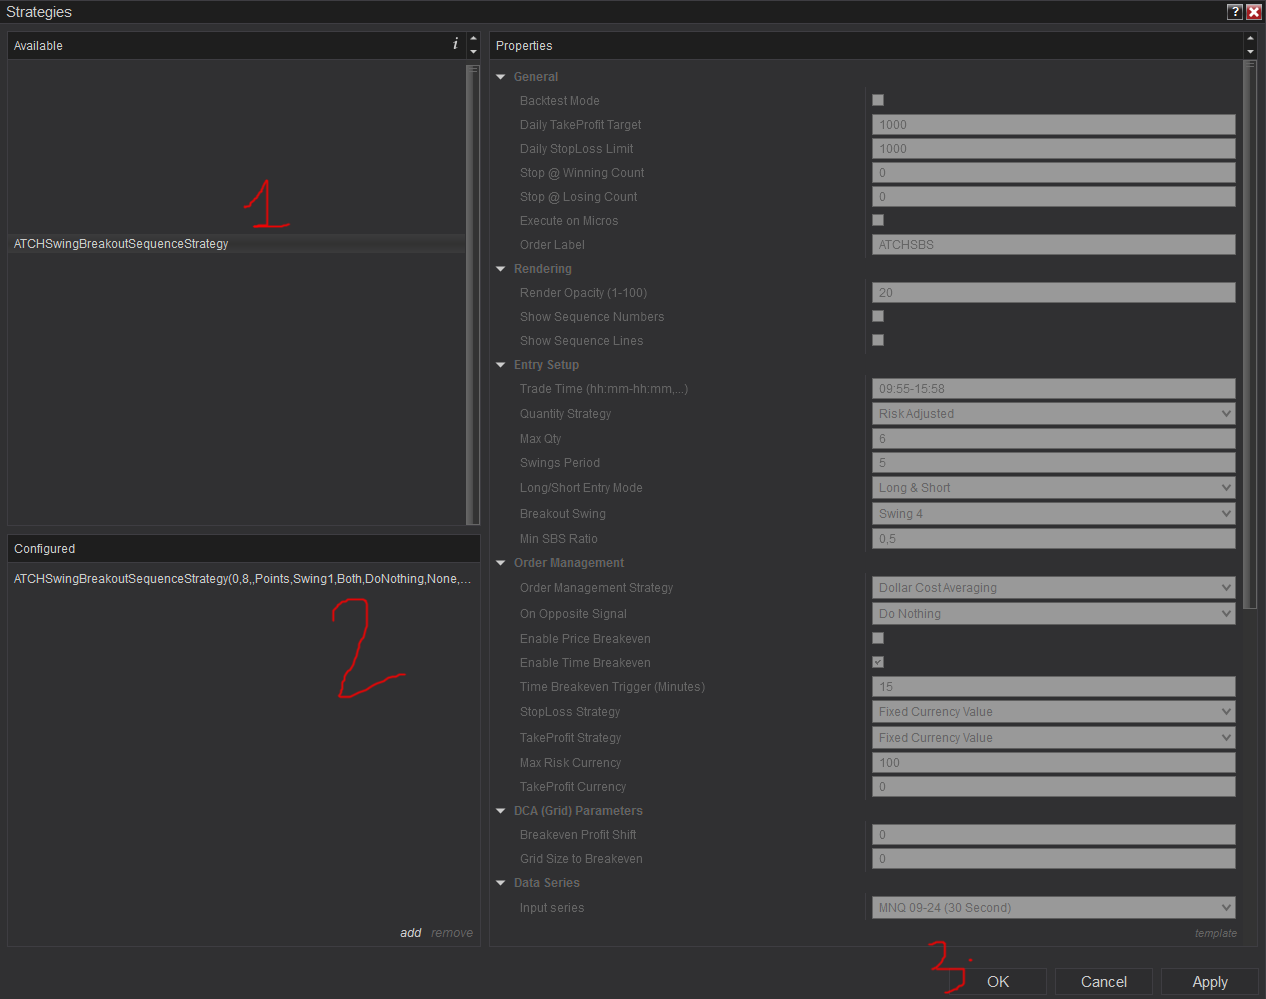
Click to enlarge - Make sure to check the Enabled check box
- After adding the strategy to the chart, the strategy will be run on Historical data loaded in the chart.
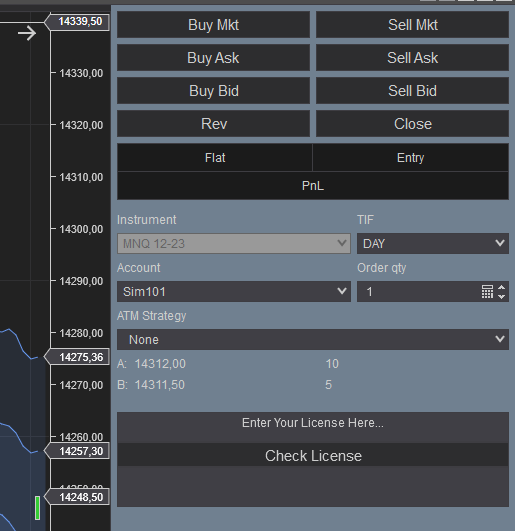
- When the Histocial data run is done, the strategy will switch to Real-Time mode and will add the license panel text box on the "Chart Trader Panel"
- Make sure to display the Chart Trader panel on your active NinjaTrader Chart
- Copy/Paste your license in the text box as shown in the image below. Your license can be found on the billing main page. Make sure to create an account or login first
- Click on the Check License Button
- At this step the strategy will check the License and activate/deactivate trading according to your subscription state
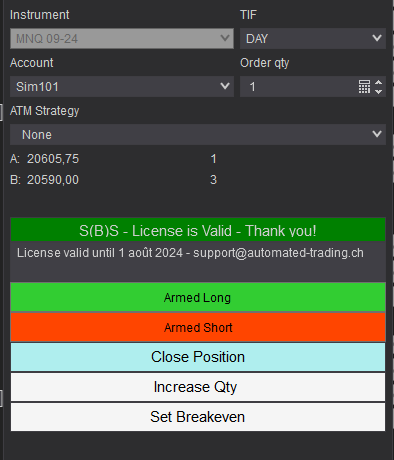
- If you have an active subscription, will see the "Check License" button turned to green, and the next verification date next to your email. License check is only required once. Until the next verification date.
- At this stage, the strategy is Ready. If your license is valid, the strategy will continue running on live mode
- If you chose to not subscribe yet, and want to test the strategy beforehand, you can run it on Playback and Historical modes

Frequently Asked Questions
General
Using a VPS is good but not imperative. I run this strategy on a ~$6 VPS Windows instance on Hetzner. Check out our resources page to get a discount through our affiliate LINK
Yes! You can run multiple instances of this strategy on the same account but each instance should be run on a unique instrument
You can't run multiple instances on the same account on the same instrument because as you know NinjaTrader will aggregate orders in one position per instrument per account
Yes! you can use a copier, but a better solution would be to run multiple instances of the strategy. The purchased license allows you to run unlimited instances on multiple machines
Yes! The strategy is designed for that exact purpose. It will work seamlessly on Rithmic, NinjaTrader brokerage, Tradovate or any other provider connected to your NinjaTrader platform
I designed this strategy to be full-automatic strategy. Yet, it can be used as a semi-auto strategy to enter trades and then let you manage those trades manually using its command buttons
You should consider full auto-trading over manual trading for many reasons:
- Trading 24/7: Automated trading strategies don't need to go to the bathroom not it need to take a break
- Better execution, faster and more precise
- Eliminate psychology and sentiments
- Can be scaled to dozens if not hundreds of instances
- Automated trading can generate truly "passive" income, manual trading is just another "more stressful" job
Yes, If you have an idea that you believe can improve the performance of this strategy, I will be more then happy to hear from you. Please use the contact page to send me a message
No, the source code of the strategy is protected for copyright reasons
Billing
Yes, you can cancel your subscription from the account page at any time to prevent future payments. We cannot refund the unused portion of your subscription, but you will be able to use your subscription even after cancelling for the remainder of the billing cycle.
No, we don't offer a trial subscription plan. But you can download and test the strategy in backtest and playback modes before subscribing
We do not offer full or partial refunds, but you may cancel your subscription at any time to stop future payments.
Skeptics
I have been a professional software developer since 2010. I have been developing automated trading strategies since 2012, for my self for fun and profit and also been developing strategies for clients all over the world
I have always been invlolved professionaly in the business of Finance and Investing, I have worked for trading brokers and investment banking.
I'm not a marketer, and I don't hire someone else to develop my strategies.
This strategy has been favorable for me on the long run with ups and downs, especially when it is run on multiple insturments. But the question remains pertinent, why I'm selling it?
The answer is I'm not selling it, I'm renting it to generate an additional income and diversify my different sources of income besides what this strategy can generate. Which you should also do. You should not rely on one source of income to reach financial independance, the key is diversification.
The edge of this strategy will not disappear if many people start using it. This strategy is purely mechanical and does not rely on a hidden quantitative pattern that should not be disclosed
Lets examine pros and cons of pending orders
- Pros:
- Best price execution when using limit orders
- Protection against losses in case of connectivity issues
- Cons:
- Can get rejected on high price volatility
- Delay between request to place the order and when it gets placed. Price volatility can cause the order to be rejected and the price to run away
- Requires management: any opposite orders need to be canceled
- Visible to the broker, placed orders can be manipulated
After years of developing strategies I reached the conclusion that market orders are better suited for the context of automated trading.
The main drawback of using pending orders is the fact that they can be rejected which is very hard to manage especially in a volatile environment
In all our strategies, we use market orders even for take profit and stop loss. Lets examine the pros and cons of market orders
- Pros:
- Guarantee of execution reagrdless of volatility conditions
- Invisible to the broker before they get submited
- No risk of being rejected which means better protection for stop loss
- Faster execution than pending orders
- Cons:
- In the case of the connection being lost with the broker, the strategy will be unable to send market orders
Remark: MIT (market if touched) orders in NinjaTrader are a solid alternative to pending orders if you really want to use pending orders
We are following the NinjaTrader official guide on how to achieve precise intrabar granularity backtesting by using additional tick level DataSeries See here for more info
Don't take my word for it. Test it yourself, at the end of each trading day, run a backtest of the strategy on that day and compare it with the live trades the strategy made during the day.
Release Notes
- Bug Fix : Error when using ATM Strategy
- Added a Decrease quantity command button
- Added "Invert Entries" Parameter
- Scaling out has added new parameters Scale out at % Target and Scale out % Qty
- Setting Breakeven takes into consideration commissions
- Fixed a modification that made a perf regression. The modification was related to swing price detection
- Added new filter : Max bars between swings
- Added Immediate on Swing 4 breakout mode
- Added SMA Slow and Fast as an entry filter
- Bug Fix crashing on new market session when running live
- Added Scale out 50% Qty at 50% Target management option
- Fix bug on Market Replay mode when session ends and a new session starts
- Fix bug on SuperTrend trailing stop, sometimes missed because the supertrend flips before the bar closes
- Added New parameter Max SBS Height points
- Fibo levels are calculated from Swing3 to extreme point. Before this release fibo levels were calculated from extreme point to swing3
- Added Fibo 0.236 as a take profit target
- Reorganization of Parameters
- Added SuperTrend as a trade management method
- Drawing of SBS sequence numbers is pixel based. This fixes the issue with numbers drawn far away on instruments like CL (oil)
- Added new parameters : Invalidation Method
- SBS sequences started on invalidated price swing are removed, this allow respecting the swing period
- Bug Fix : Breakeven mechanism was not triggered for long trades
- Command button Increase position was also triggering breakeven
- Command button breakeven was sometimes closing positions
- Bug Fix : ATM usage was crashing the Strategy
- Command button Close now closes ATM positions
- When in optimization mode drawing objects are disposed for faster optimizations
- Added Entry mode selection : Immediate or wait for FVG
- Added "Min Grid Gap" and "Bar Close Trigger" parameters to DCA (Grid) management method
- Bug Fix when using ATM strategy
- Added Max Allowed Risk per trade seperate from Target Risk per trade
- Bug fix: Trailing stop mechanism should be triggered outside trade time.
- Added StopLoss & Takeprofit line drawing with drag & drop capabilities
- Bug Fix: Weekly profit target calculation fixed
- Bug Fix: When timezone of Ninjatrader is already EST and selected timezone is EST, current time has a glitch
- Bug Fix: Currency risk closes a position even before stoploss level is hit. Fixed by making only the stoploss level closes the position
- Bug Fix: "Trailing stop" now works fine when "stoploss strategy" is set to "Fixed currency value"
- Bug Fix: rare case of an error when few data is loaded on the chart
- Auto submit of License on Billing cycle date
- On optimization Strategy Analyzer, all parameters are displayed
- Clear warning message when strategy is added from the Strategy Tab and not from within a Chart
- Added weekly profit target
- Major fixes when the Take Profit method is set to Swing3
- Stop Loss calculation updated to include Prior Swing, Swing4 and Swing5
- Fix Chart Panel Glitch when changing tabs
- Removed strong condition on Swing5 price. Before this update, Swing5 required to be below/above Swing4. This condition was removed which now means that Swing4 and Swing5 are only required to be successive Swing Lows (for bullish) or Swing Highs (for bearish) regardless of whether Swing5 is higher or lower than Swing4
- Bug Fix: Running the strategy on multiple accounts overlaps daily limit stops
- Detection Rule less strict for more pattern detection
- Added Fibonacci Retracement Breakout method
- Added Trade Time zone selection : EST or local time
- Added Min & Max SBS Bars count as a filter
- Added Classic Trailing Stop management method
- Fix issue with entry
- Update parameter refresh logic
- Added stoploss offset in points
- Added Swing 3 as a new take profit strategy
- First Release of the strategy
User Comments & Feedback
You can find feedback of our users and ask questions about this strategy by joining our discord community by following this invite link or clicking on the Discord logo image. Joining is completely free
![]()
