Index
Prequisites
To use this indicator you should have available the following prequisites
- NinjaTrader 8. Click here to download
- Order Flow data is not required to use this indicator (you don't need to have a Lifetime license)
- automated-trading.ch account to obtain a free license key. To obtain the license key, simply Signup and then get your license on the billing page
We highly recommend joining our discord community by following this invite link
![]()
Description
The NinjaTrader 8 Highs & Lows indicator presents an alternative approach to identify Market Structure. The logic used is inspired from the following highs & lows TradingView indicator Protected Highs & Lows [TFO]
This indicator introduces the new concept of protected swing pivot points that is used to determine Market structure events such as:
- MSS: Change of strucutre (or Change of Character or Market Structure Shift) that indicates that the trend might change
- BBOS: Break of Strucutre (or Market Structure Break) that indicates a continuation of the trend
What are protected Swings?
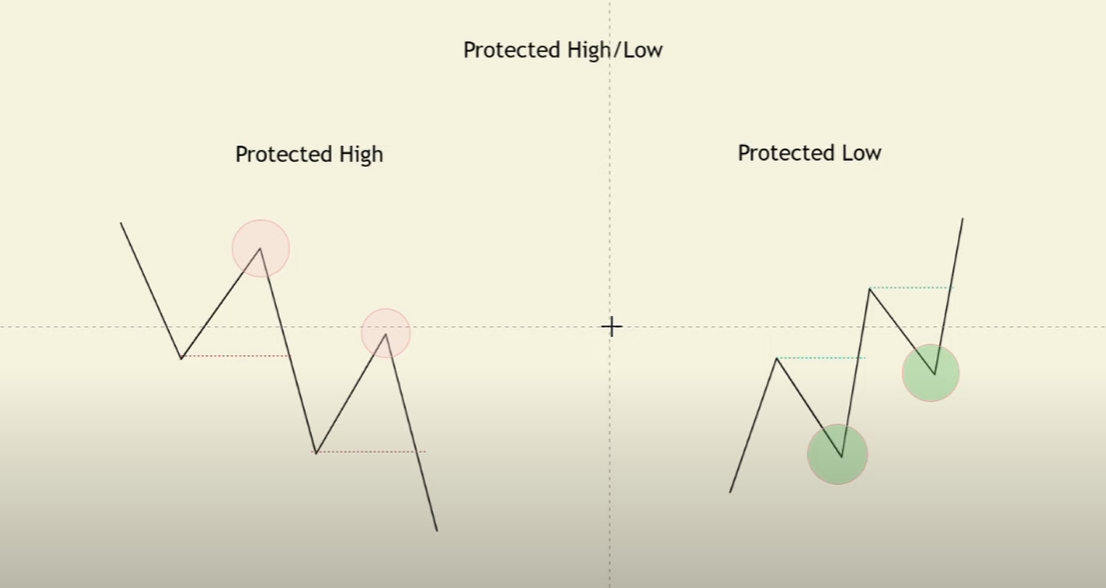
When price closes below a valid swing low, we look back from the current bar to find the highest high that was made in that range. This becomes our protected high; similarly, when price closes above a valid swing high, we look back from the current bar to find the lowest low that was made in that range, which then becomes our protected low.
If a higher high is established, then the price doesn't close below the last established lower low, that high high is not considered as a protected swing. Same for the low side, if a lower low is established and then the price doesn't close above the last established higher high, that lower low is not a protected swing.
Examples
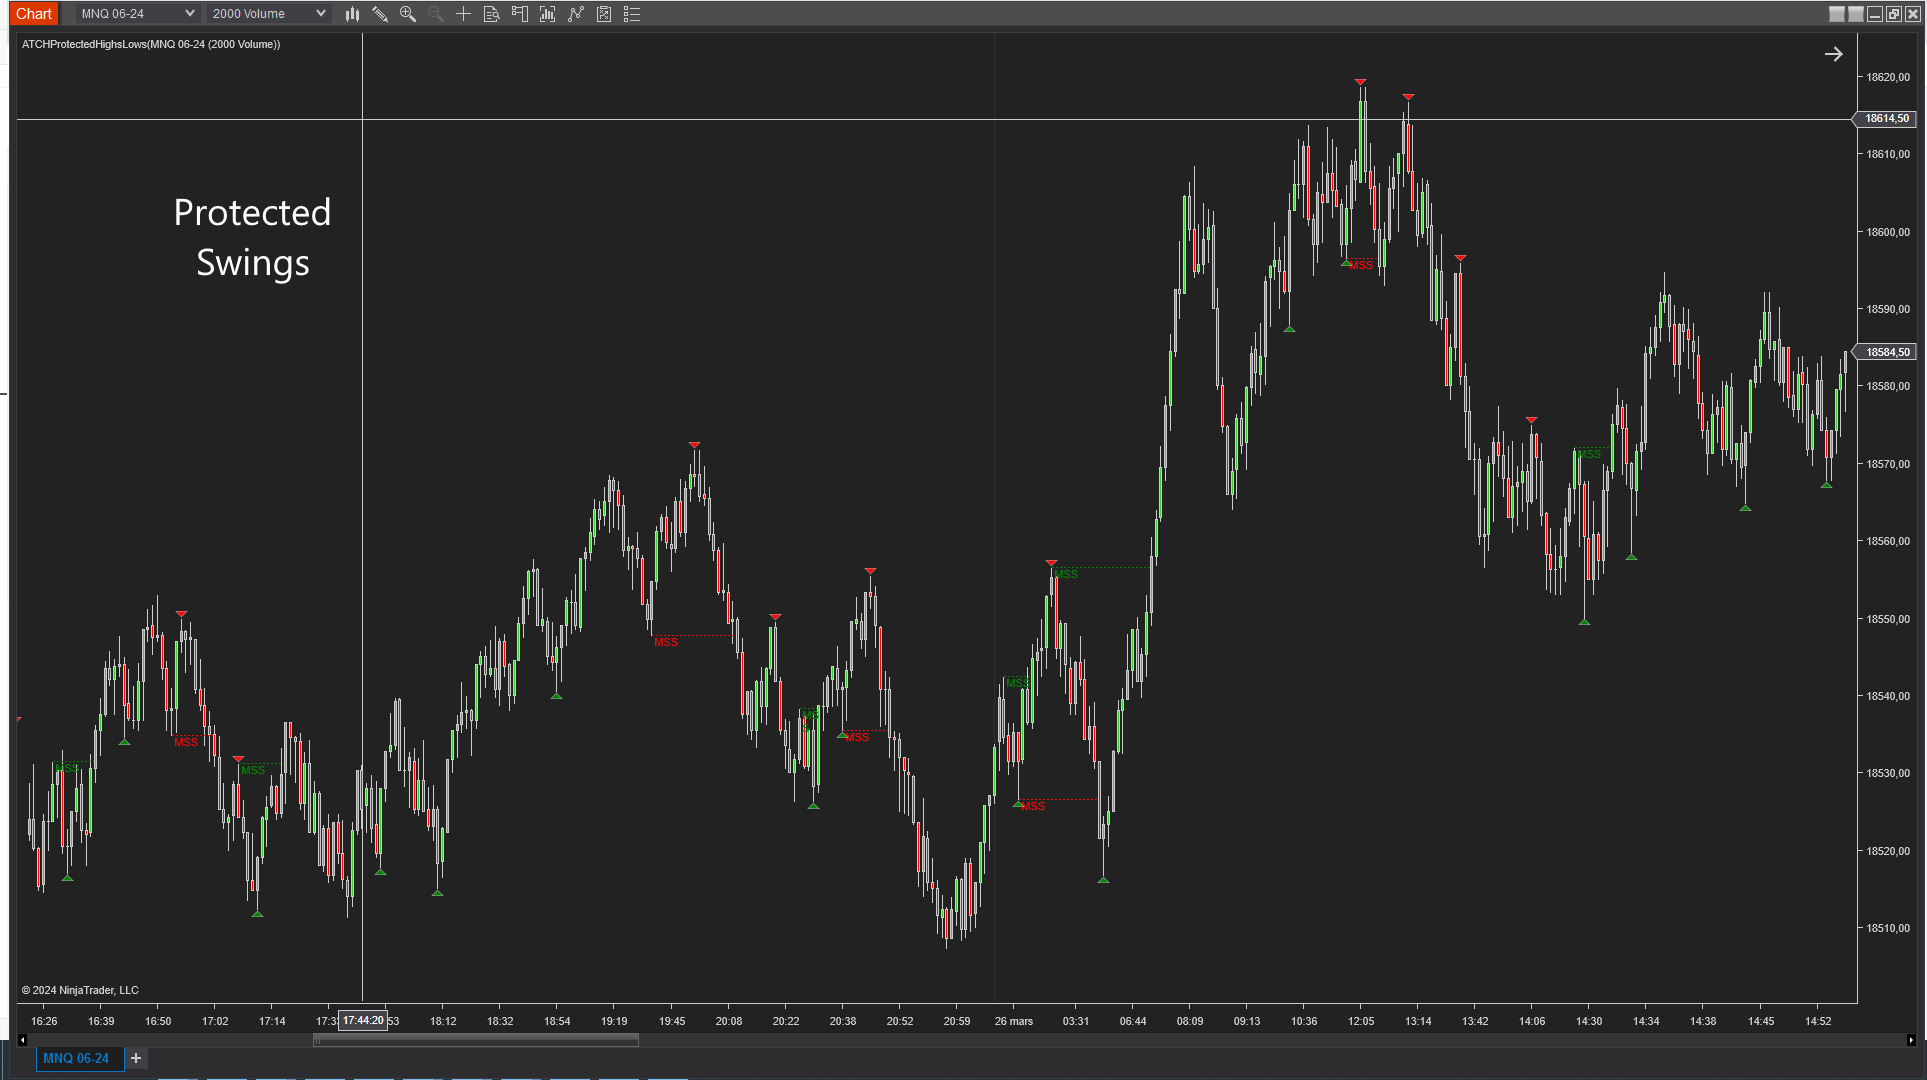
Here are few examples of how the indicator works:
In this example we see a Chart of MNQ on the 2000 Volume timeframe. The pivot swings arrows that you see in Red and In Green on top and on bottom of the candlesticks are protected swings
Features
The Protected Highs & Lows indicator has a set of unique features
- Free. The indicator is completely free to use.
- Plots Break of Structure and Change of Stucture
- Highly customizable, lightweight and can be adapted to wide range of instruments
Parameters
We always try to keep the parameters to minimum.
| License | |
| License | This is the free license key you get when you create an account on automated-trading.ch. After creating an account, copy your license key from the billing page. You need to set this parameter only once per month, once the license key is validated it will be remembered for the rest of the billing cycle. |
| Swings | |
| Swing Period | Swings are higher lows,higher highs, lower highs and lower lows. After each price bar close, a swing can be detected. But just after that, the next bar can cancel the swing at the previous bar by creating a new swing of the same type. Or this can happen on the second bar, or the third, etc... The swing period sets how many bars is enough to seperate two swings of the same type. The more you increase this parameter, the more you decrease the number of swings overall. The more you decrease this parameter, the more you increase the number of overall swings. I personally use the value of 3 or 4 for this parameter. |
| Run on Higher Timeframe | This will make the Swing detection algorithm run on a higher timeframe, and drawn on the current active chart timeframe |
| Higher TimeFrame | This parameter allows to select the higher timeframe on which the swing points will be detected. Make sure to select a higher time-frame in regard of the active charts' timeframe. For example, if the current time-frame on the chart is 15 Minutes, make sure that the value of this parameter represents a bigger time-frame such as 1 Hour. If in that case you select 1 Minute as a higher time-frame for example, the indicator will not work. |
| Higher TimeFrame Period | This parameter sets the period of the higher timeframe |
| Structures | |
| Show Structures |
This parameter sets which market structure to show/hide
|
| Show Valid Swings | Enable/Disable drawing of valid swings as a circle |
| Extend Retracement Bars | Number of Bars to extend the retracement levels |
| Play Sound | This parameter will enable playing and alert sound when an event (MSS or BOS) is detected |
| Play Sound On Valid Swings | This parameter will enable playing a sound when a valid swing is detected |
| Play Sound File | This parameter will set the file name to be played on sound alert. This can be set to any .wav file on your computer |
| Rendering | |
| Retracement Color | Draw Color of Retracement levels |
| Bearish Color | Draw Color of bearish items to draw on the chart |
| Bullish Color | Draw Color of bullish items to draw on the chart |
| Draw Offset (Points) | This sets an offset in points that is to be used when drawing markers of swings and valid swings on the chart. |
Download & Installation Instructions
The indicator can be downloaded for free. To download and install the indicator follow the instructions below
- Click on the below download button to download the Indicator file
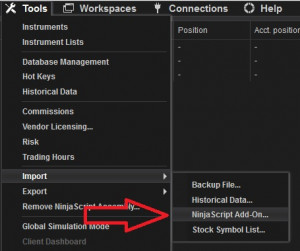
- Import the downloaded .zip file into NinjaTrader using the import NinjaScript menu item
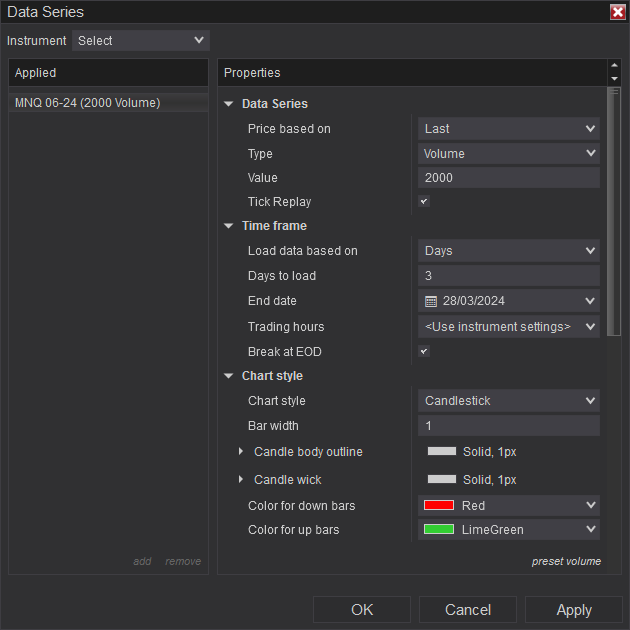
- Next, open a new chart window
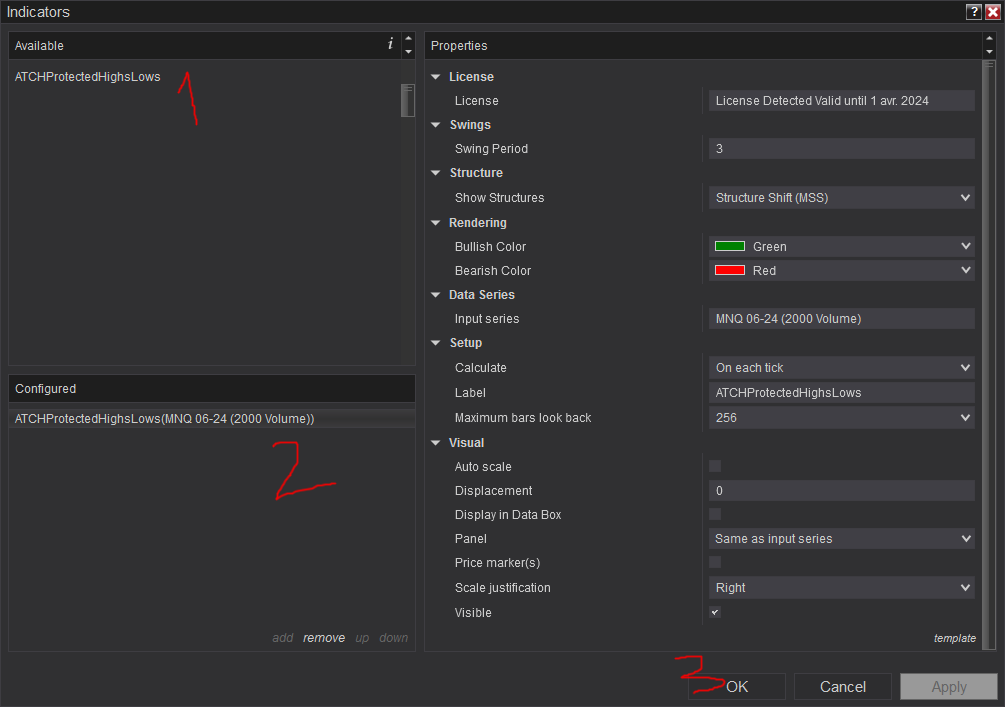
- After installing the indicator and opening a new Chart window you should add the indicator to the chart. Right-click on the chart and click on Indicators...
- After adding the indicator to the chart, the indiactor will be run on Historical data loaded in the chart.
- After that, the indicator is added with success and will continue to run on live market data
Frequantly Asked Questions
General
Yes, If you have an idea that you believe can improve this indicator, I will be more then happy to hear from you. Please use the contact page to send me a message
No, the source code of the indicator is protected for copyright reasons
No, this indicator only do rendering and doesn't provide data that can be used from within a strategy. Check out our other strategies for an ICT Concepts based strategy
Yes you can use this indicator without TickReplay
Release Notes
- Bug Fix with index
- Added Playsound on Valid Swings
- Added Playsound
- Added Offset drawing in points
- Added Retracement Color
- Fixed Serialization of parameter templates
- Fixed the algorithm of detection of protected highs & lows.
- Added drawing of retracement, valid swings...
- Added higher timeframe analysis.
- Fixed the algorithm of detection of market structure by making it based on protected highs & lows only.
- Added None as a display option
- First Release of the indicator
User Comments & Feedback
You can find feedback of our users and ask questions about this strategy by joining our discord community by following this invite link or clicking on the Discord logo image. Joining is completely free
![]()