

Price Action 2nd Entry Indicator for NinjaTrader 8
 Created 25 Aug 2024
·
Updated 11 Aug 2025
Created 25 Aug 2024
·
Updated 11 Aug 2025
The Price Action 2nd Entry indicator is a Premium NinjaTrader 8 indicator that shows 2nd Entry signals as defined by Mack's PATS (Price Action Trading System) strategy.
Prerequisites
To properly use this indicator you should have the following prerequisites available.
- NinjaTrader 8, with any license type. Click here to download
- Order Flow data is not required to use this indicator.
- An automated-trading.ch account with an active Premium Subscription
Description
The idea behind the 2nd entry indicator is that price moves in a two-wave pattern composed of a first pullback that generates a failed attempt to break the first swing in the move, followed by a second high-probability pullback that pushes the price to move a certain number of ticks that can be traded for profit. This pattern happens very frequently during the trading session.
Examples
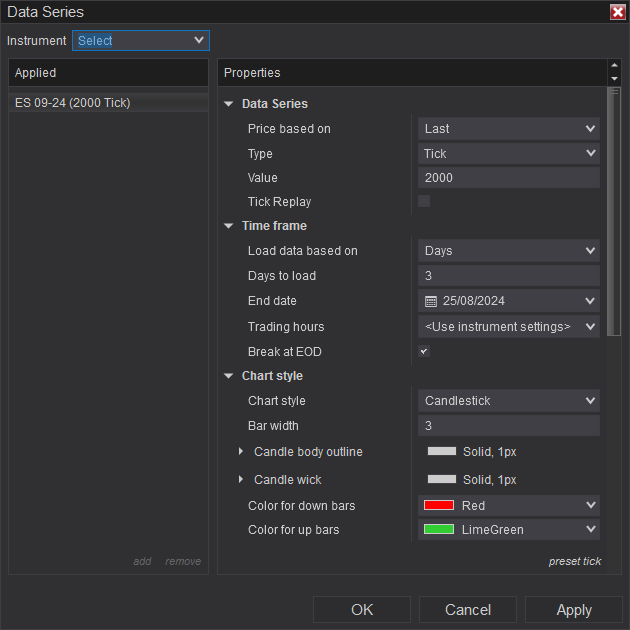
2000 Ticks Timeframe of ES
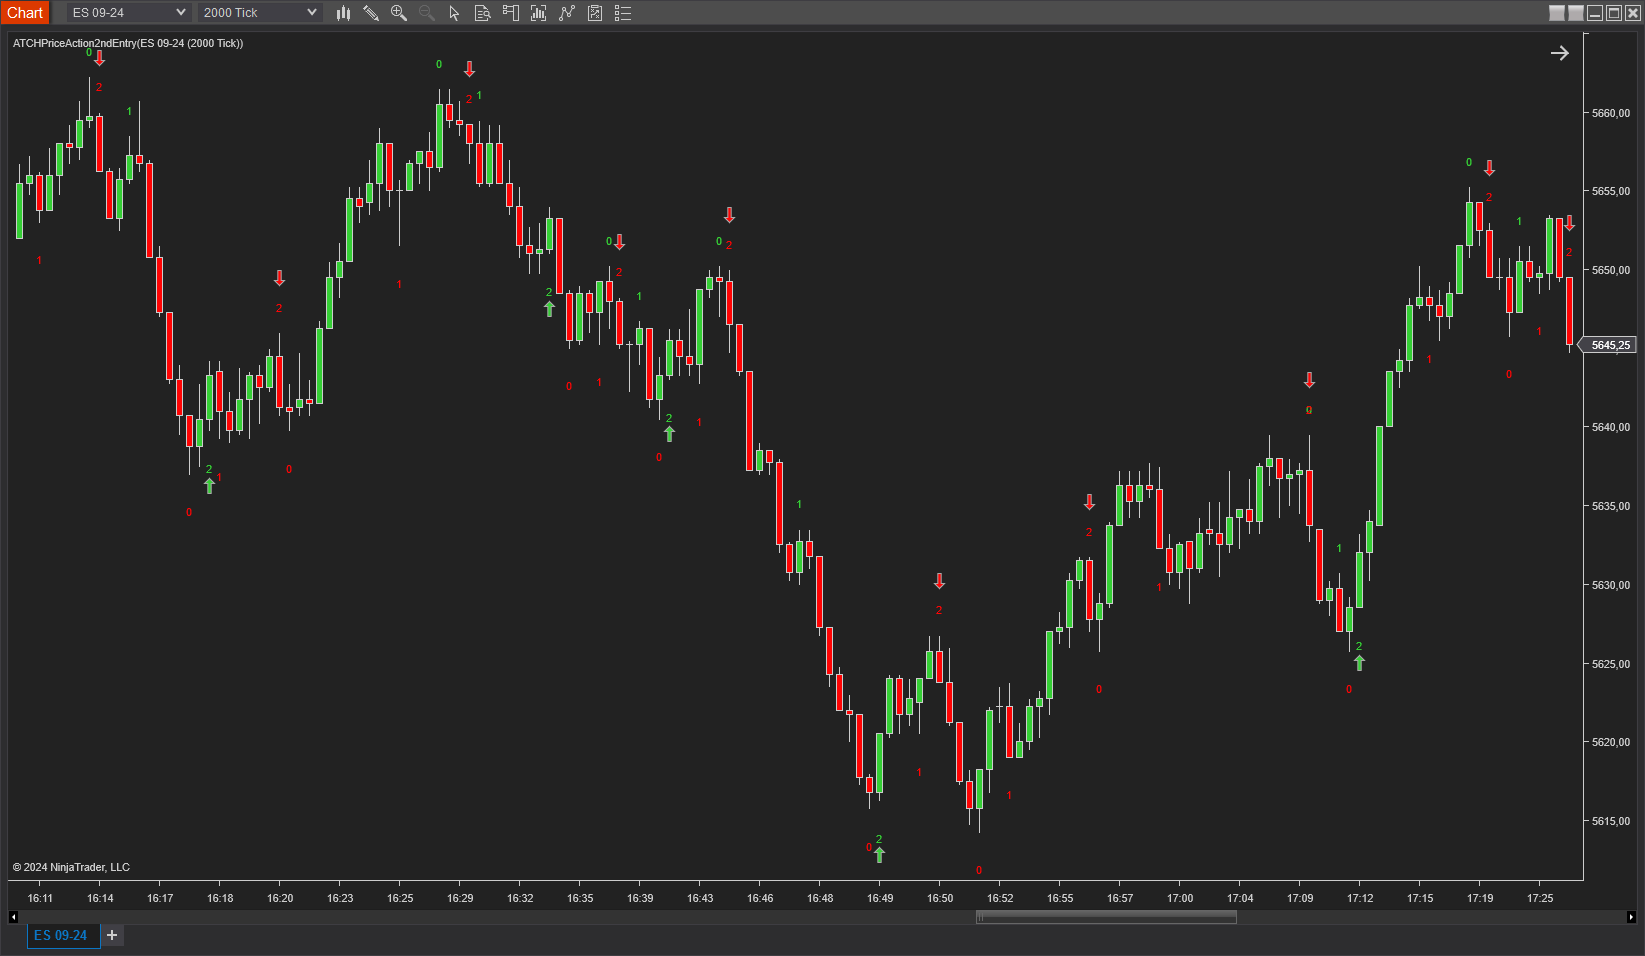
The indicator draws counting numbers in two colors — green for bullish and red for bearish sequences (these colors can of course be adjusted). Each counting sequence starts with a Higher-High for bullish sequences, or a Lower-Low for bearish sequences; at that swing point, the indicator prints the number 0.
If, after drawing 0 on a level, the price breaks that swing point and makes a new Higher-High or Lower-Low, the drawn 0 is removed and a new 0 is drawn, marking the start of a new counting sequence.
The algorithm then searches for the first failed attempt: the price pulls back at least one tick higher or lower than the previous price bar, then continues going farther from the initial start of the counting sequence (down for a bullish sequence, up for a bearish one). If the price, after pulling back, continues and breaks the initial start of the counting sequence, the pattern is marked invalid and removed from the chart.
After detecting the first failed attempt, the algorithm seeks the second attempt, which is the high-probability entry setup: the second pullback where the price breaks the previous candle's higher (bullish) or lower (bearish) wick, and closes with a green (bullish) or red (bearish) candle.
When this happens, the indicator draws an arrow marking a valid, high-probability entry signal, and can optionally play a sound.
Features
The Price Action Second Entry indicator has a set of unique features:
- Replaces manual counting efforts with mechanical counting
- Can play a sound on each detected entry signal along with a drawn arrow
- Can be run with or without TickReplay on any timeframe
Parameters
We always try to keep the parameters to a minimum.
| Market Structure | |
| Swing Period | Swings are higher lows, higher highs, lower highs, and lower lows. After each price bar close, a swing can be detected, but the next bar (or the second, or third...) can cancel it by creating a new swing of the same type. This parameter sets how many bars is enough to separate two swings of the same type — the higher this value, the fewer swings overall; the lower, the more swings. A value of 3 or 4 is a common choice. |
| Rendering | |
| Render Opacity | The opacity used to render the sequence counting numbers on the chart. |
| Bearish Color | Draw color of bearish items. |
| Bullish Color | Draw color of bullish items. |
| Show Swings | Controls whether swing points are shown on the chart. |
| Counting Numbers Gap (points) | Controls the drawing gap, in points, between the candle wicks and the counting numbers. |
| Show Signal Arrow | Controls whether entry signal arrows are shown. |
| General | |
| Confirmation Mode |
|
| Require Previous Candle Breakout | Only used when Confirmation Mode is Bar Close. When enabled, requires the last bar of the sequence to close above/below its previous bar's high/low wick; when disabled, the confirmation bar only needs its high/low to exceed the previous bar's. |
| Play Sound | Enables playing an alert sound when an entry signal is detected. |
| Play Sound File | The file name played on sound alert — can be set to any .wav file on your computer. |
Signals & Usage in Strategy Builder
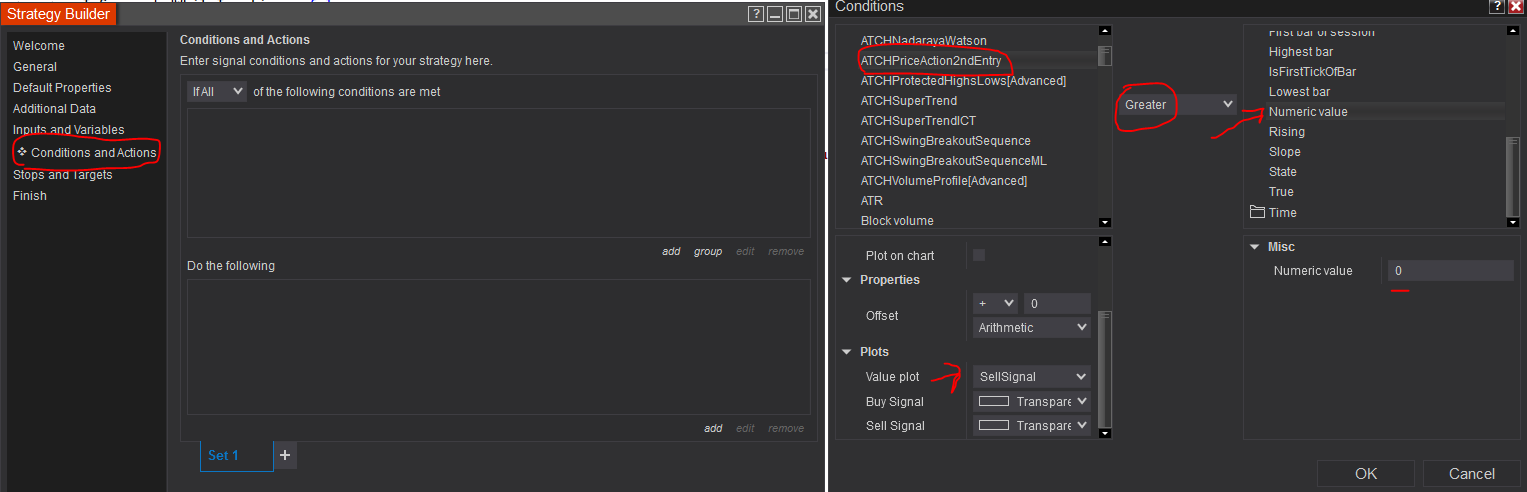
The indicator exposes signal plots that can be used from the Strategy Builder and third-party software such as Bloodhound and AlgoStudio.
Those signal plots are transparent and aren't drawn on the chart. From the Strategy Builder, you can select them and build logic on their values — the Buy signal and Sell signal plots contain the value of the last price when a long/short signal is generated, and 0 otherwise.
Download & Installation Instructions
License Requirements
At automated-trading.ch you can choose to either purchase a monthly subscription to use our premium products, or use our free products without subscribing.
In both cases, you need to create an account so you can get a License you can use for both premium and free products.
To obtain your license, simply sign up and then get your license on the billing page.
Download
You can also download this strategy — and every other automated-trading.ch strategy or indicator — anytime from your centralized Downloads page.
Installation Steps
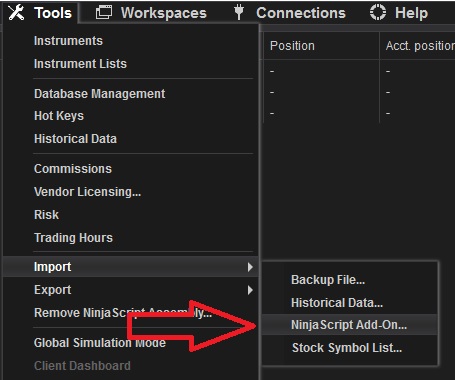
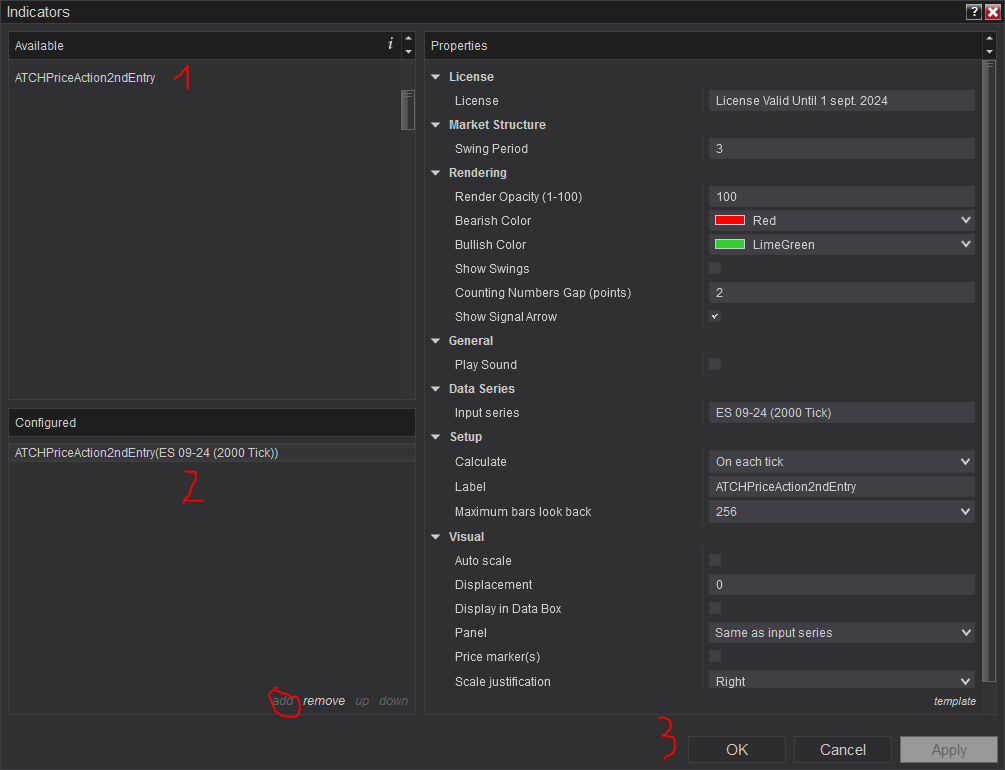
Frequently Asked Questions
General
Subscriptions Q&A
Release Notes
- Added "Require Previous Candle Breakout" option for bar confirmation mode; Changed parameters order/grouping
- Fix conflict import issue with Opening Range Breakout Strategy
- Fix importing the indicator into Ninjatrader bug
- Added Confirmation Mode parameter ("First Tick" / "Bar Close")
- Fixed drawing glitch of number "2" signal in Real time; Fix Bug: indicator hides Grid lines when added to chart
- Added Buy Signal / Sell Signal plots usable in Strategy Builder, Bloodhound, AlgoStudio
- First Release of the indicator