

ICT Concepts Indicator
 Created 07 Jan 2024
·
Updated 20 Jul 2025
Created 07 Jan 2024
·
Updated 20 Jul 2025
The ICT Concepts indicator is a Free NinjaTrader 8 indicator which displays key concepts of the ICT trading methodology and style.
Prerequisites
To properly use this indicator you should have the following prerequisites available.
- NinjaTrader 8, with any license type. Click here to download
- Order Flow data is not required to use this indicator (you don't need to have a Lifetime license).
- An automated-trading.ch account with an active Free account (no paid subscription required)
Description
Those key concepts are the following:
- Change of Structure (or Change of Character, or Market Structure Shift) that indicates that the trend might change
- Break of Structure (or Market Structure Break) that indicates a continuation of the trend
- Fair Value Gaps, which represent displacements of price and are defined as instances of inefficiencies or imbalances visualized by three consecutive candles containing one large middle candle whose bordering candles' upper and lower wicks do not overlap
- Order Blocks, which represent crucial support and resistance levels derived from aggressive price movement, and can be used as entry or exit levels
The ICT Concepts indicator can be used in a multi-timeframe setting, applied on a higher timeframe while visualized on a smaller one.
Examples
Market Structure Shift & Market Structure Break
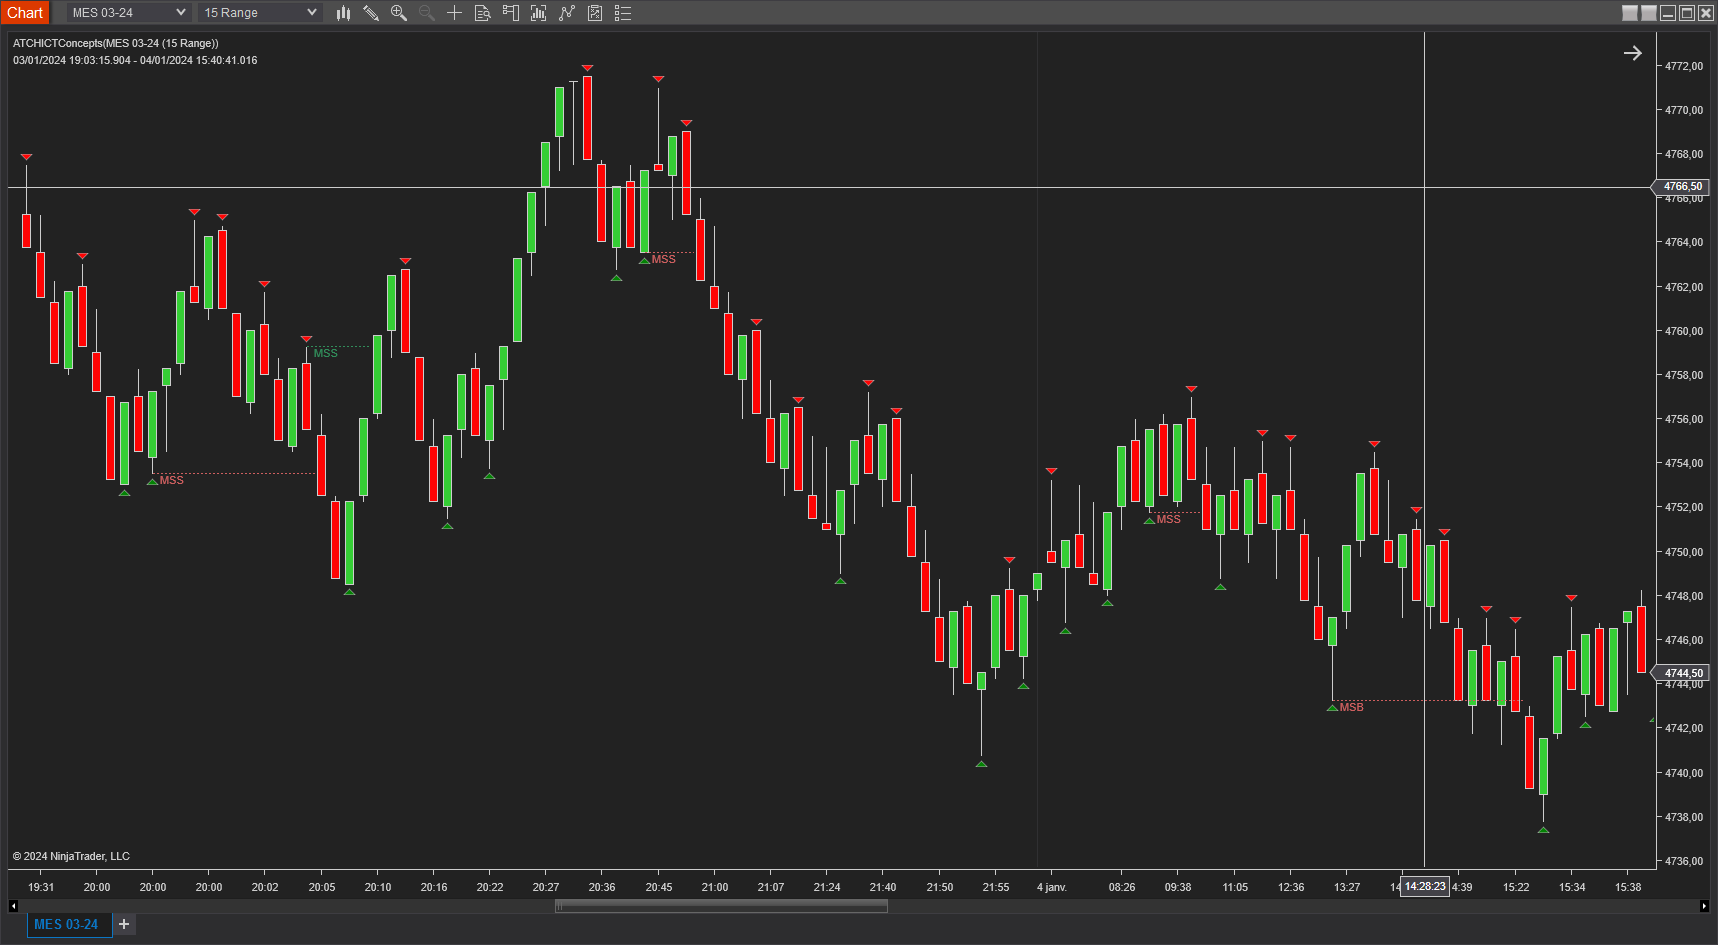
Market structure shifts and market structure breaks can be drawn on any chart — for example on a 15-range chart on the S&P micros. With a different set of swing-related parameters, this can be adapted to another timeframe or instrument. In one such example, 3 price swings are used to define a trend.
Fair Value Gaps
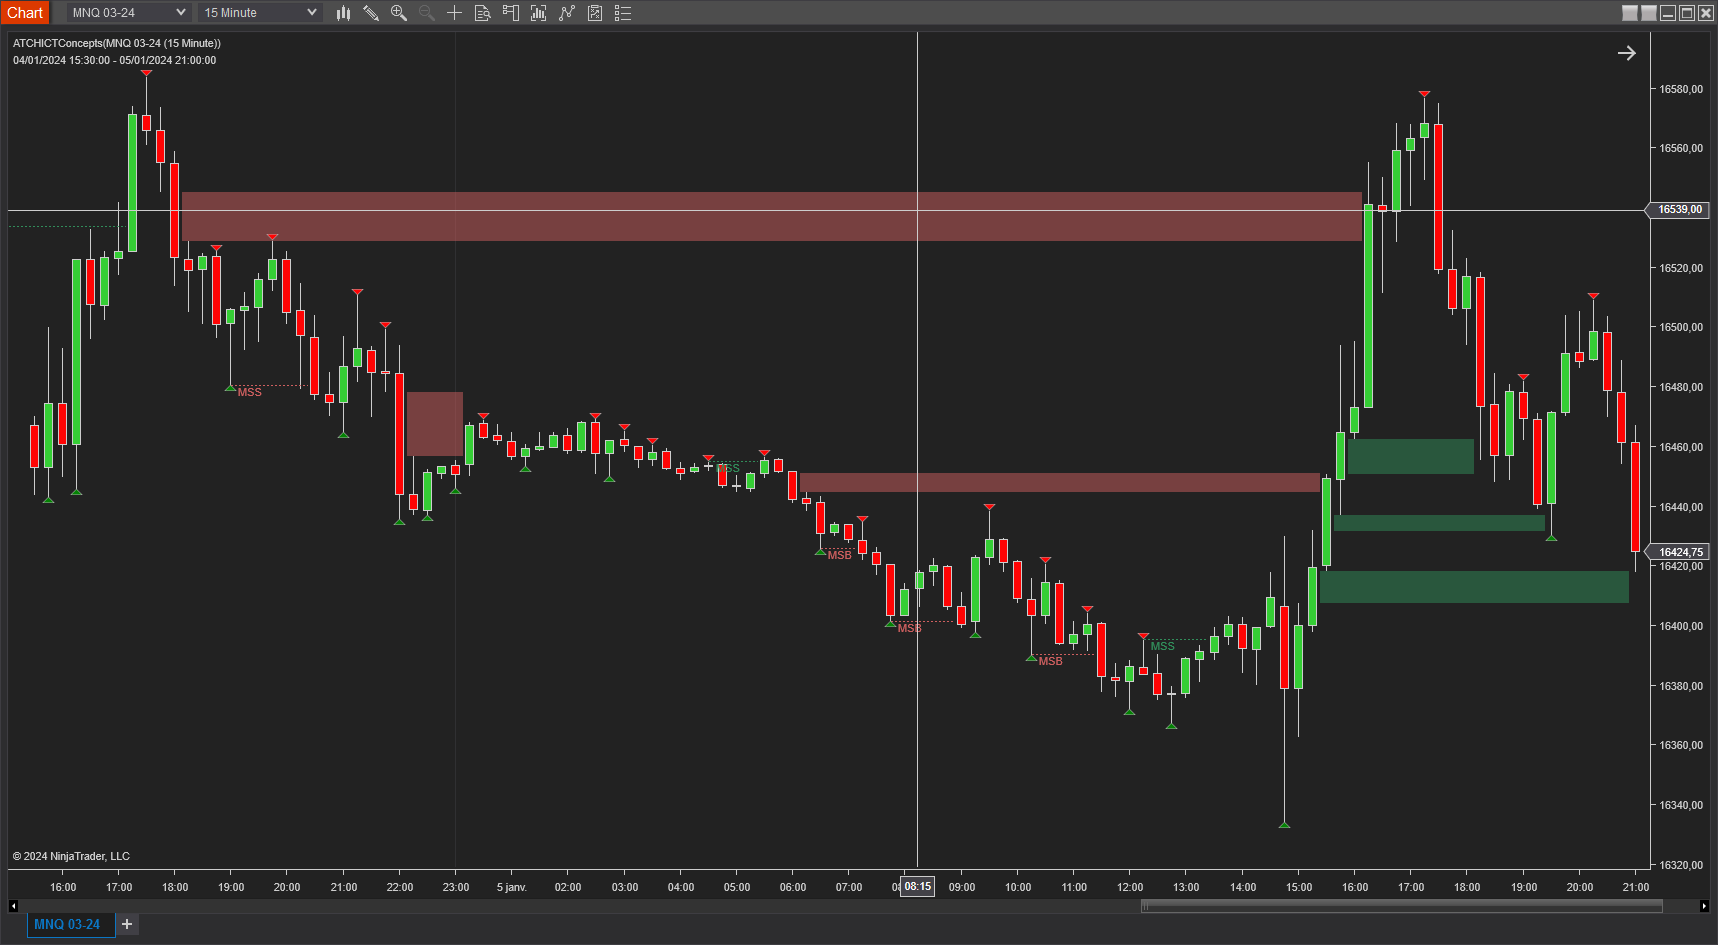
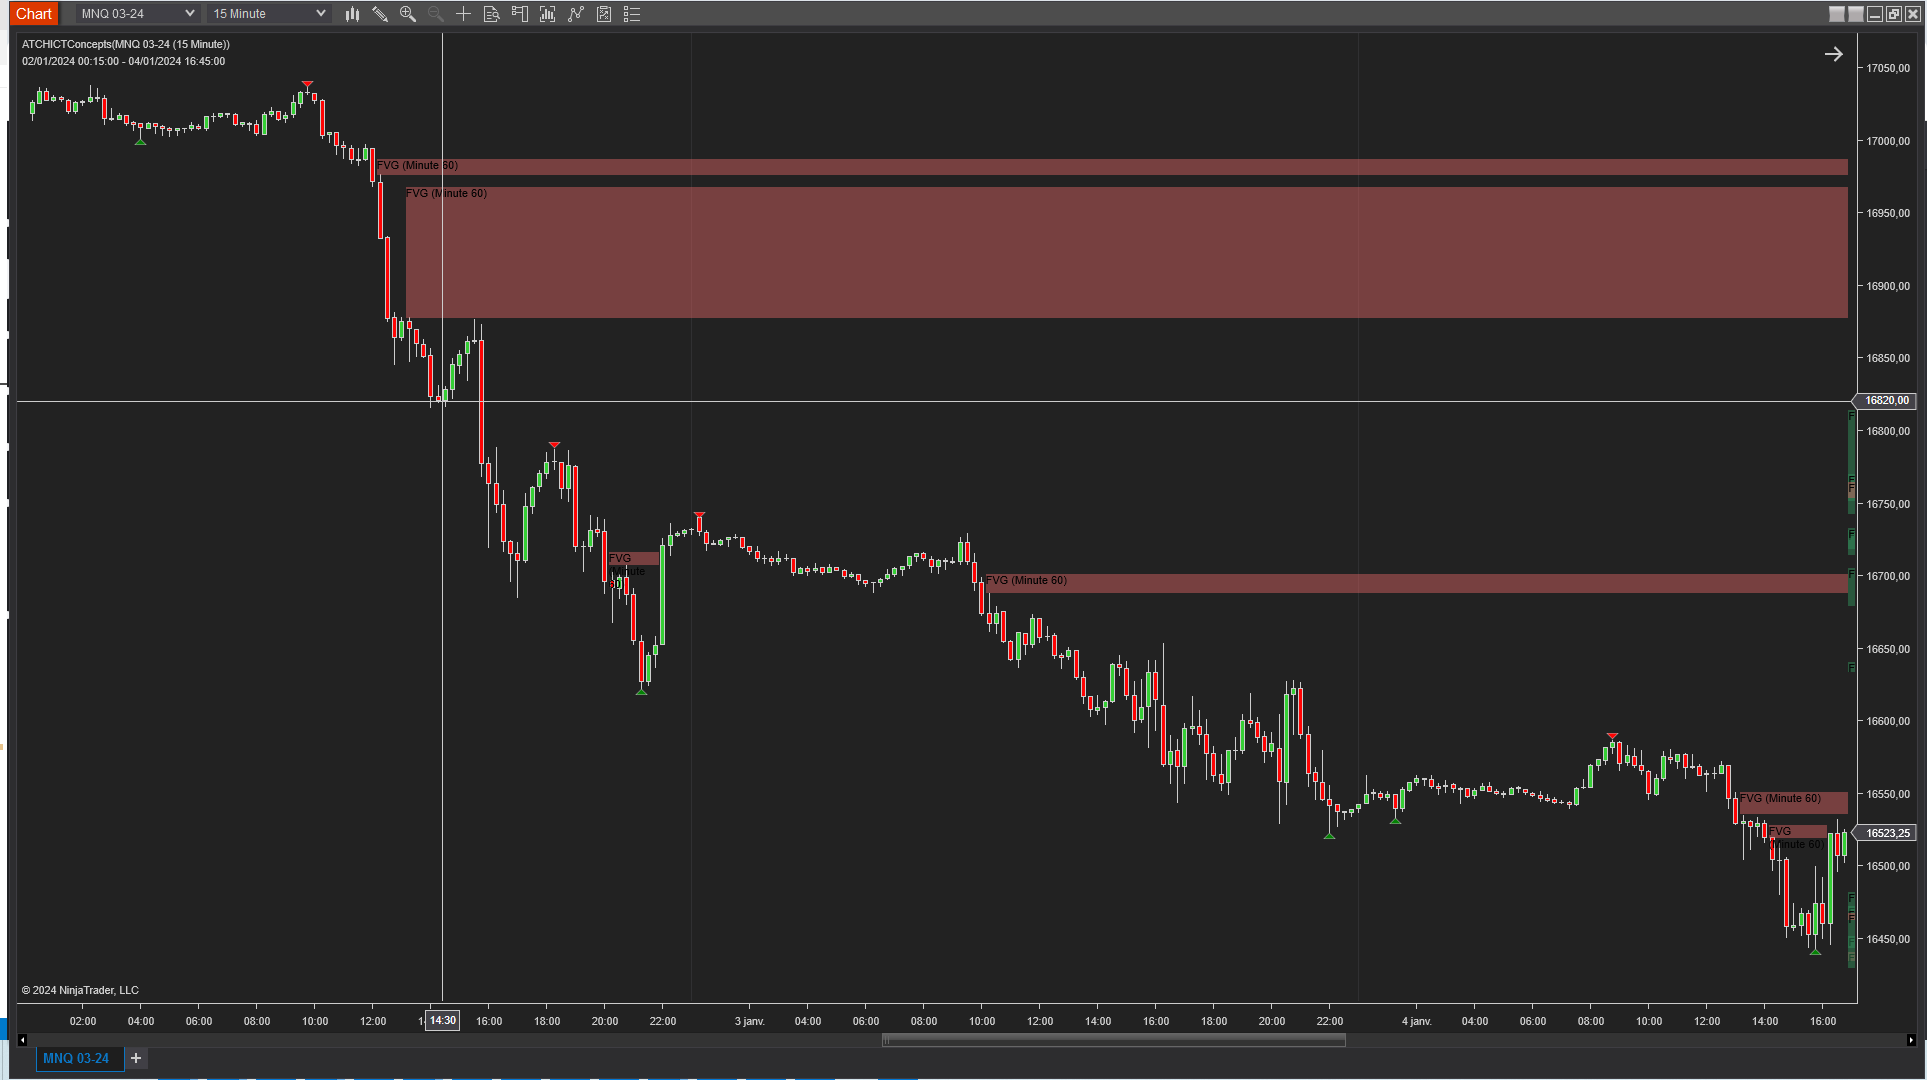
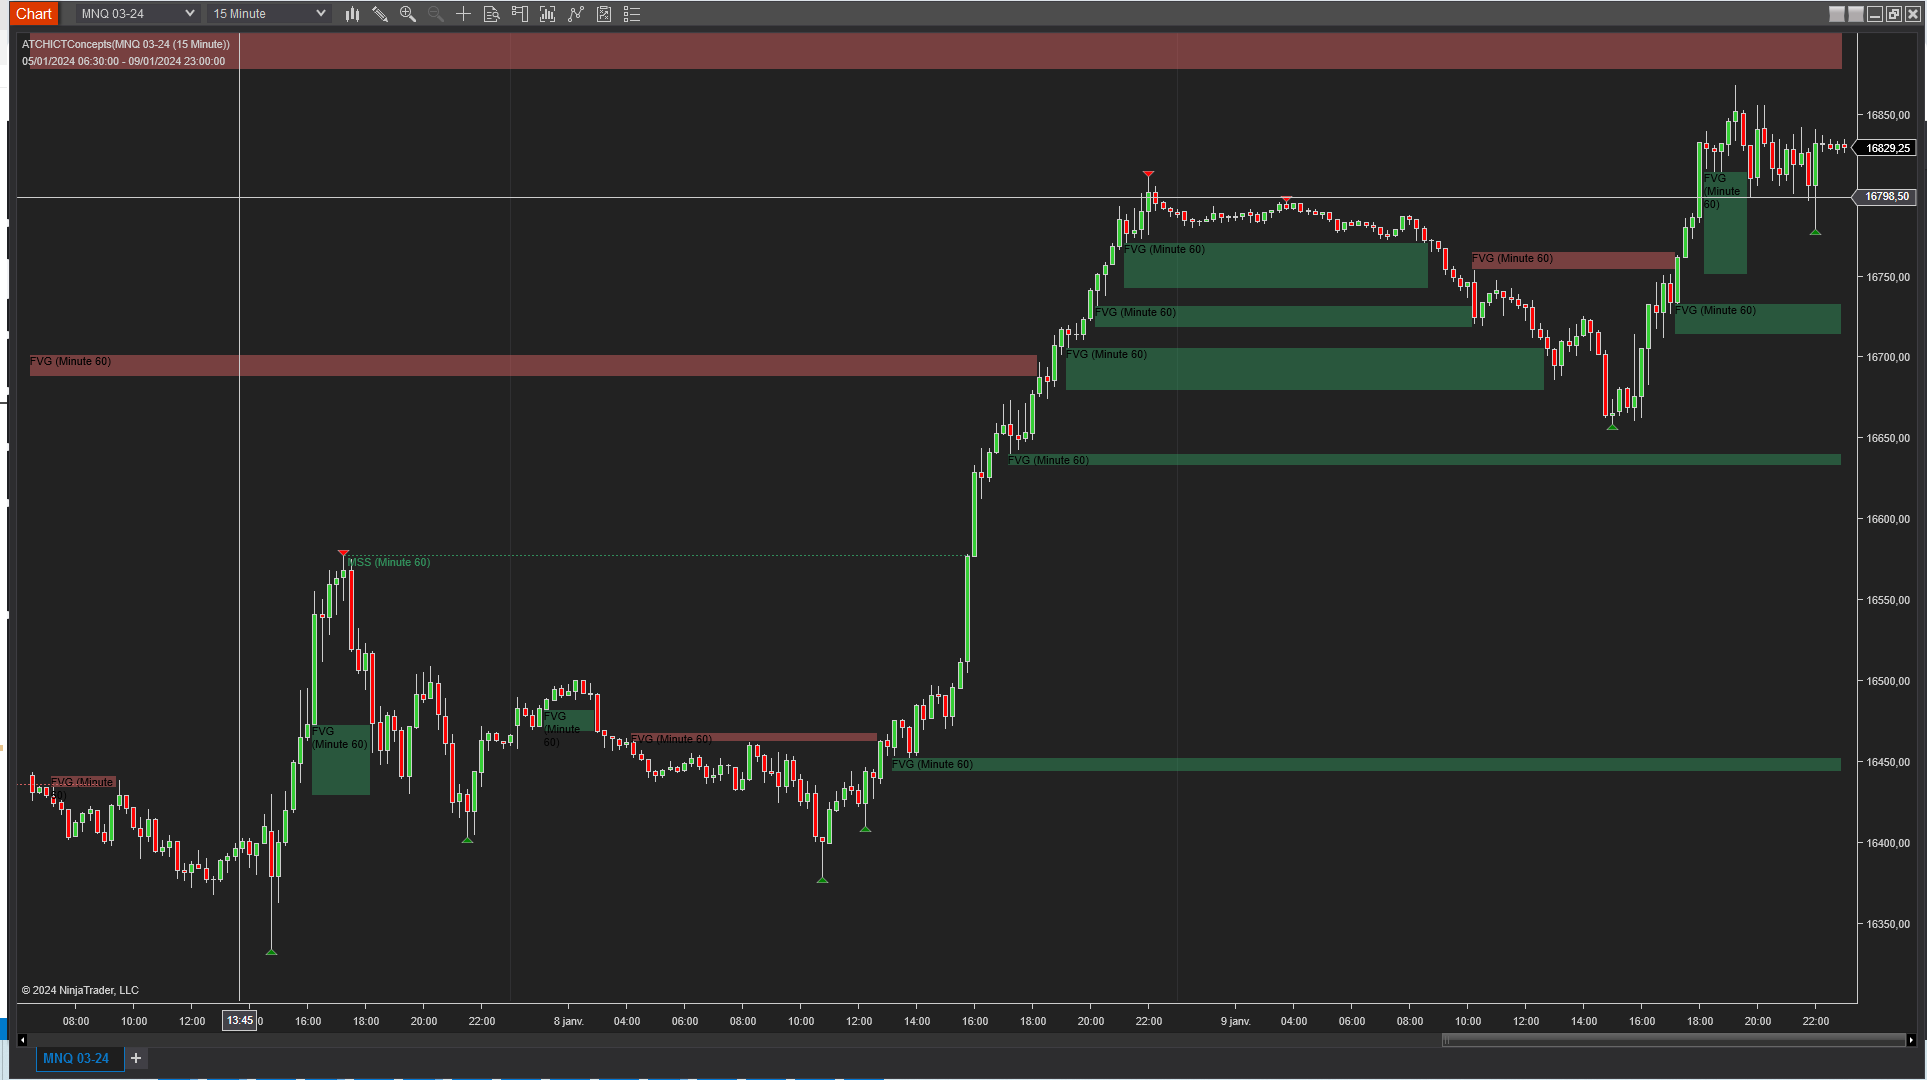
The indicator can detect several Fair Value Gaps — for example on the MNQ instrument on a 15-minute timeframe. Coupled with MSS and MSB, FVGs can be a very good signal to enter a trade. Bullish FVGs are drawn in green, bearish FVGs in red, and their drawing stops once they're retested or mitigated.
Breaker Blocks
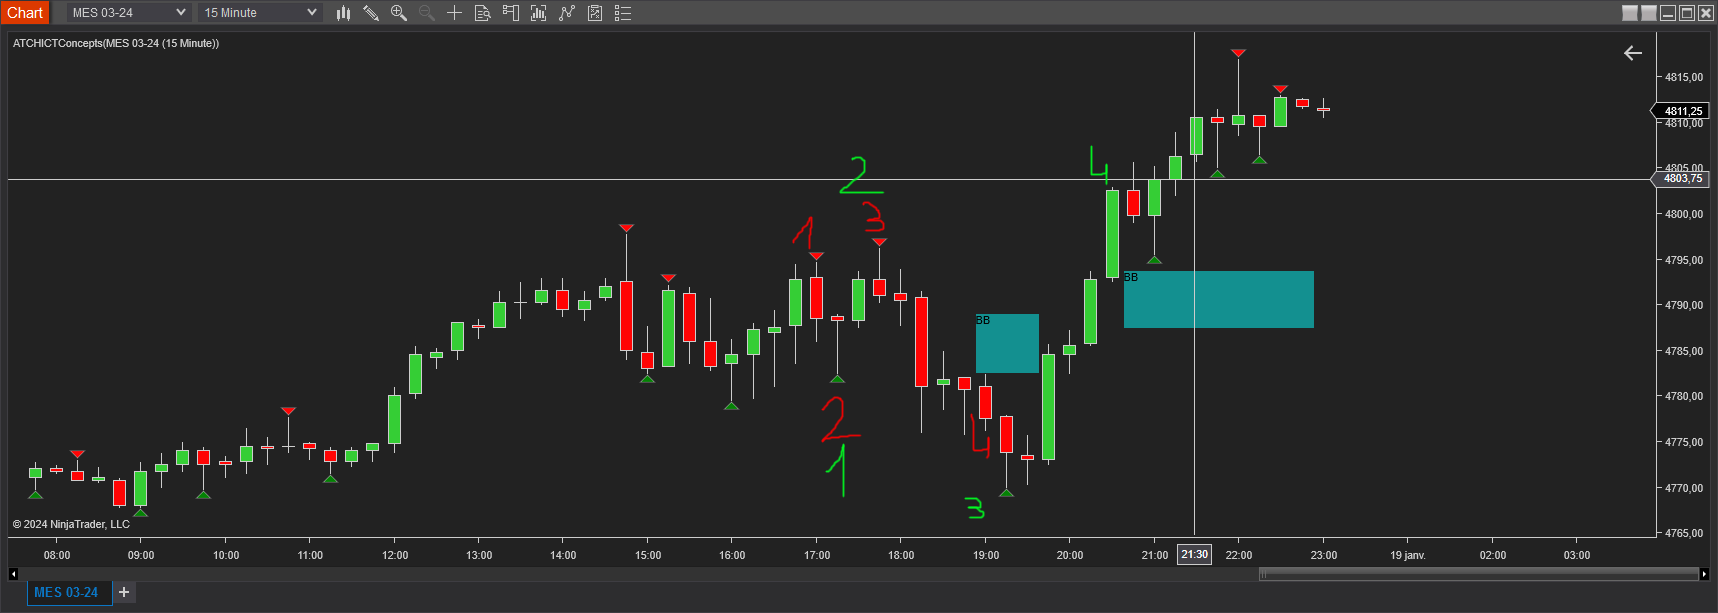
Inner Circle Trader (ICT) defined a breaker block as a failed Order Block created after a liquidity sweep and shift in the market structure. Breaker blocks are detected between 4 price swings. For a bullish breaker block: Swing Low → Swing High → Lower Low → Higher High, with the zone defined by the last bullish candle that created the first Swing High. For a bearish breaker block: Swing High → Swing Low → Higher High → Lower Low, with the zone defined by the last bearish candle that created the first Swing Low.
Order Blocks
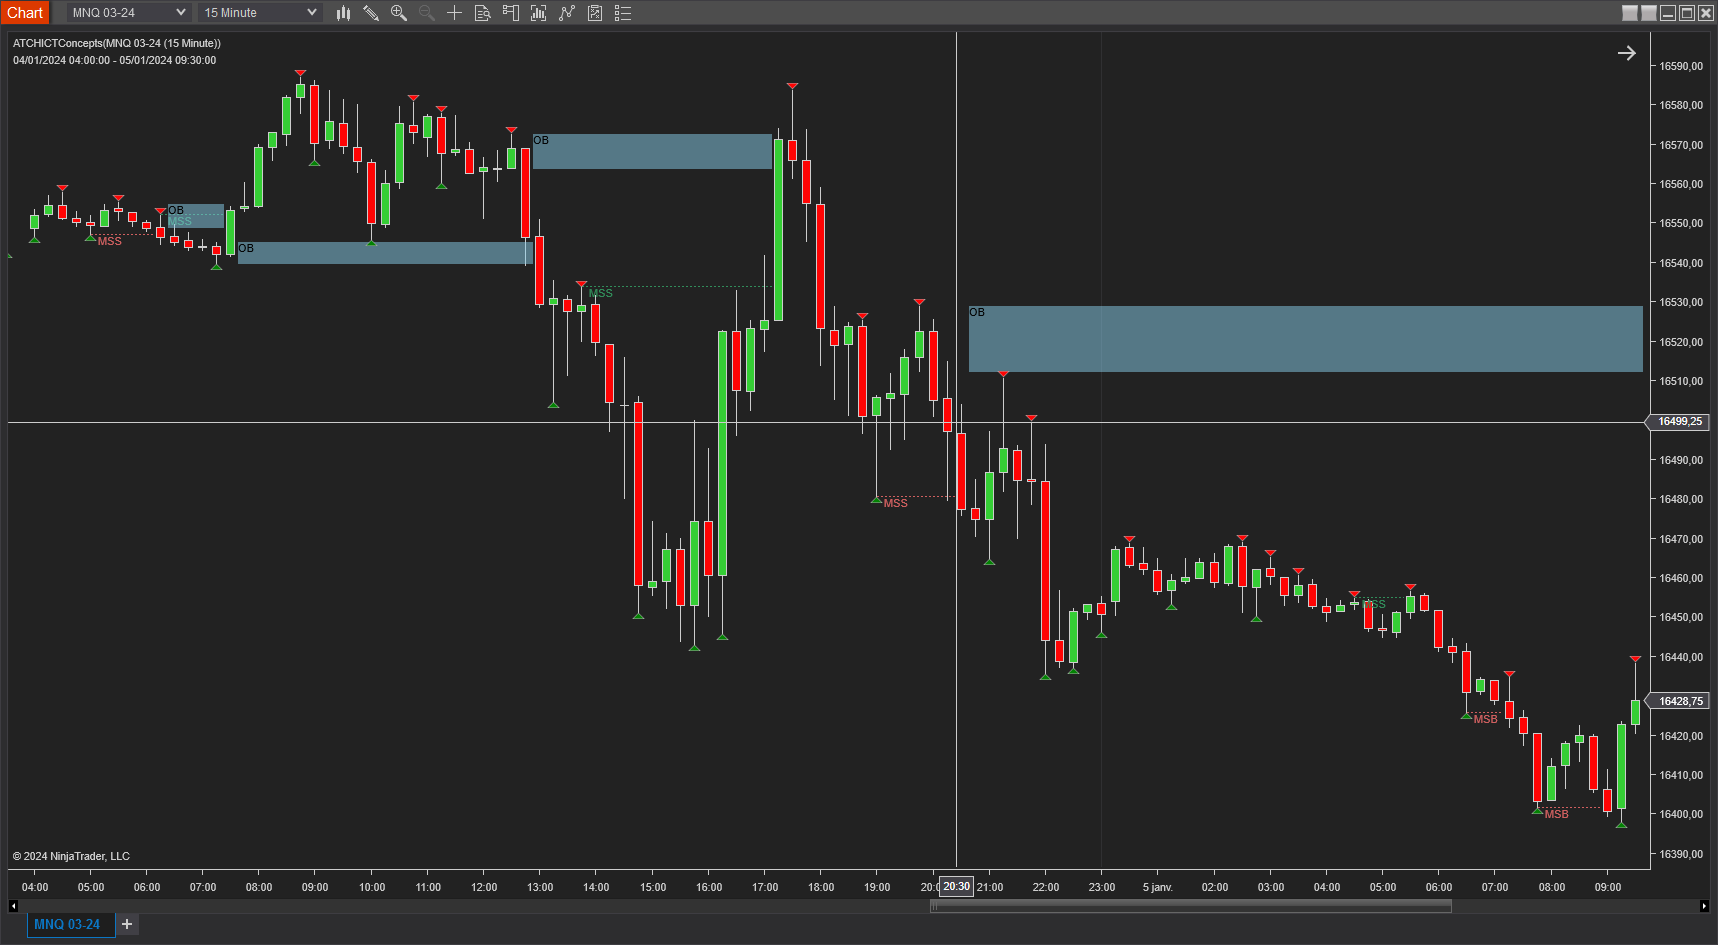
Order Blocks are hard to define. According to the ICT methodology, they are regions of aggressive price movement — zones where price moves out of a consolidation range with force. After extensive research, three criteria define an order block for this indicator:
- Order Blocks occur after a market structure shift or market structure break
- They should be followed by a strong price move creating a gap
- They should not be mitigated
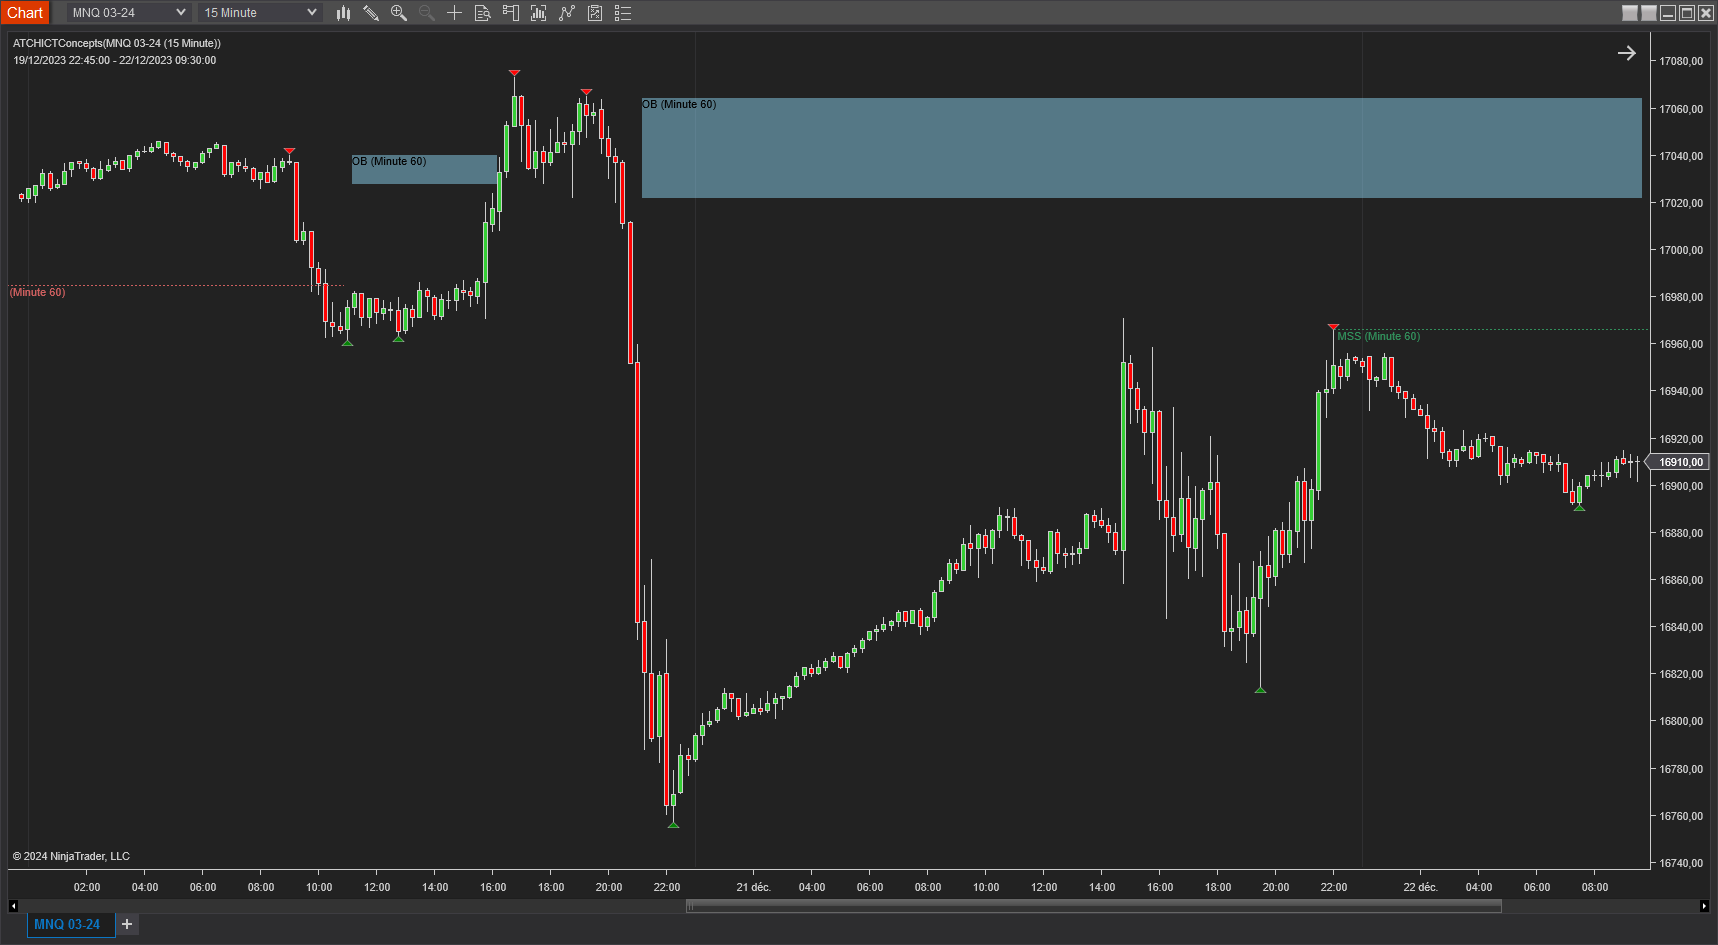
Once these 3 criteria are met, the Order Block zone is drawn, defined by the high/low of the last opposite candle in the direction of the move. Order blocks are drawn in the same color (default blue) for both long and short types, and labeled "OB".
Higher Timeframe MSS & MSB
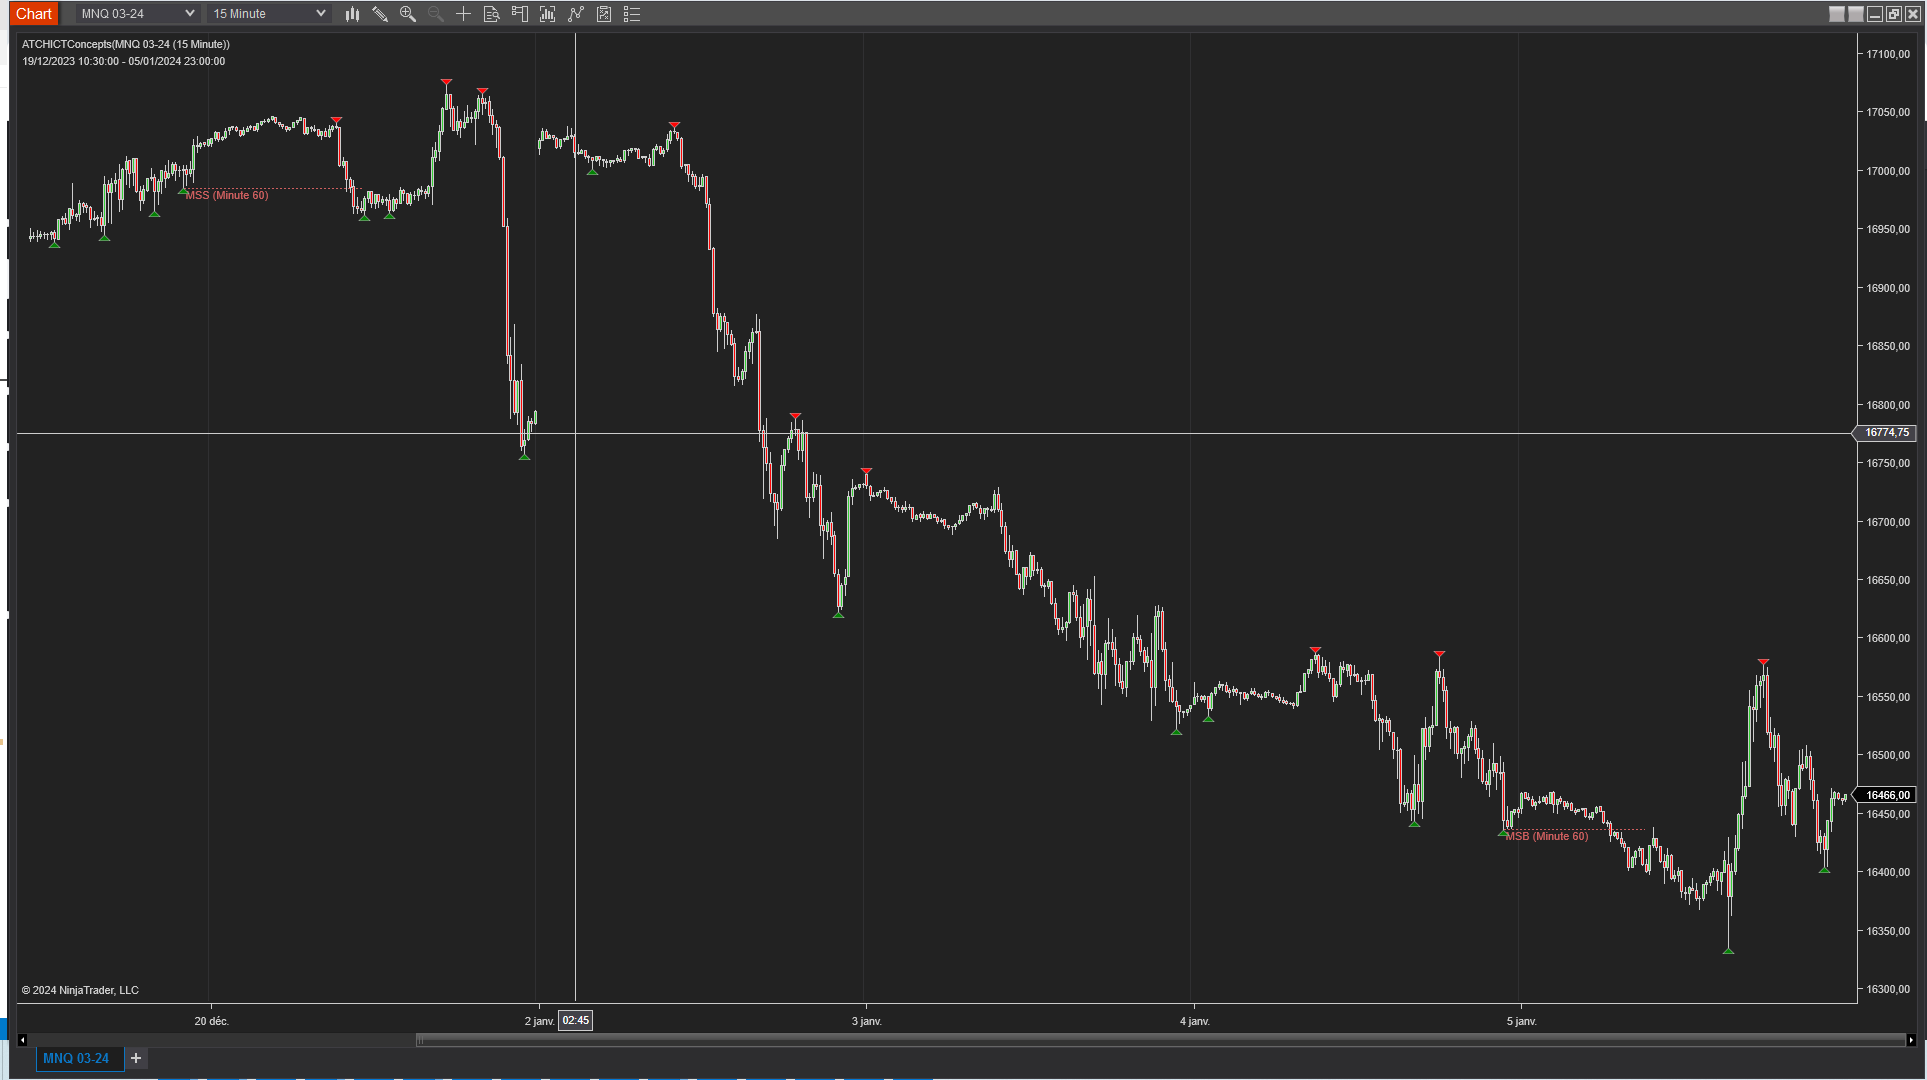
One of the most valuable features of this indicator is the ability to apply it on higher timeframes — for example running swing and market structure detection on the higher 60-minute timeframe while the indicator itself runs on the lower 15-minute chart. Price swings identified on the 60-minute bars are drawn on the current 15-minute bars, the same for Market Structure Shift and Market Structure Break.
Higher Timeframe Order Blocks
Order blocks can likewise be detected on a higher timeframe — for example two bearish order blocks detected on the higher 60-minute timeframe and drawn on the current 15-minute lower timeframe. The order block starts drawing at the close of the 60-minute candle, which explains the horizontal gap and small drawing delay.
Higher Timeframe Fair Value Gaps
The same logic of higher-timeframe analysis and drawing also applies to Fair Value Gaps — detected on a higher timeframe of 60 minutes and drawn on the current lower timeframe of 15 minutes.
Features
The ICT Concepts indicator has a set of unique features:
- Free. The indicator is completely free to use.
- Can be used on a higher timeframe for multi-timeframe support
- Plots Break of Structure and Change of Structure
- Plots Fair Value Gaps
- Plots Order Blocks
- Plots Breaker Blocks
- Highly customizable, lightweight, and can be adapted to a wide range of instruments
Parameters
We always try to keep the parameters to a minimum.
| License | |
| License | This is the free license key you get when you create an account on automated-trading.ch. After creating an account, copy your license key from the billing page. You need to set this parameter only once per month — once the license key is validated it will be remembered for the rest of the billing cycle. |
| Rendering | |
| Render Opacity (1-100) | The opacity used to render ICT objects on the chart. |
| Bearish Color | Draw color of bearish items on the chart. |
| Bullish Color | Draw color of bullish items on the chart. |
| Order Block Color | Draw color of order blocks — the same color is used for both support and resistance order blocks. |
| Breaker Block Color | Draw color of breaker blocks — the same color is used for both support and resistance breaker blocks. |
| General | |
| Run On Higher TimeFrame | Enables/disables running the ICT detection algorithm on a higher timeframe and displaying the objects on the active chart. |
| Higher TimeFrame | Selects the higher timeframe on which the ICT engine runs and ICT objects are detected. Must be a bigger timeframe than the active chart's — e.g. if the chart is on 15 Minutes, pick something like 1 Hour; picking a smaller timeframe (e.g. 1 Minute) will not work. |
| Higher TimeFrame Period | Sets the period of the higher timeframe. |
| Extension Mode |
Sets the mode of extending the drawing of zones such as Fair Value Gaps, order blocks, and breaker blocks.
|
| Market Structure | |
| Swing Period | Sets how many bars are enough to separate two swings of the same type. The higher this value, the fewer swings overall; the lower, the more swings overall. A value of 3 or 4 is typical. |
| Show Swings | Enables/disables drawing swings on the chart. Swings are always analyzed and processed regardless of this parameter, which only affects visibility. |
| Trend Swing Count | Sets the number of successive swings required to define a trend. For example, a value of 3 makes the indicator look for a market structure shift or break after 3 consecutive low swings going up or 3 consecutive high swings going down. |
| Show Market Structure Shift (MSS) | Enables/disables drawing of Market Structure Shifts. |
| Show Market Structure Break (MSB) | Enables/disables drawing of Market Structure Breaks. |
| Show Order Blocks | Enables/disables drawing of Order Blocks. |
| Show Breaker Blocks | Enables/disables drawing of Breaker Blocks. |
| Fair Value Gap | |
| Show Fair Value Gaps | Enables/disables drawing of Fair Value Gaps. |
| Min. Gap (ticks) | Sets the minimum distance in ticks between the wicks of the Fair Value Gap for it to be valid. The higher this value, the fewer FVGs are detected; the lower, the more. |
| FairValueGap Filter |
Sets a filter for FVG detection.
|
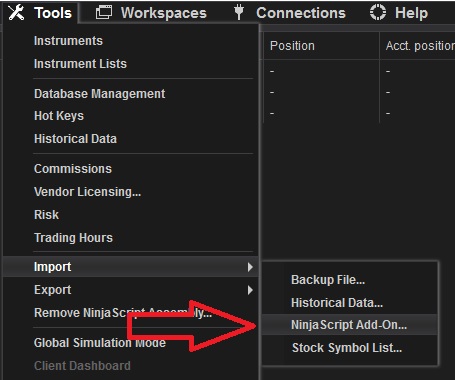
Download & Installation Instructions
License Requirements
At automated-trading.ch you can choose to either purchase a monthly subscription to use our premium products, or use our free products without subscribing.
In both cases, you need to create an account so you can get a License you can use for both premium and free products.
To obtain your license, simply sign up and then get your license on the billing page.
Download
You can also download this strategy — and every other automated-trading.ch strategy or indicator — anytime from your centralized Downloads page.
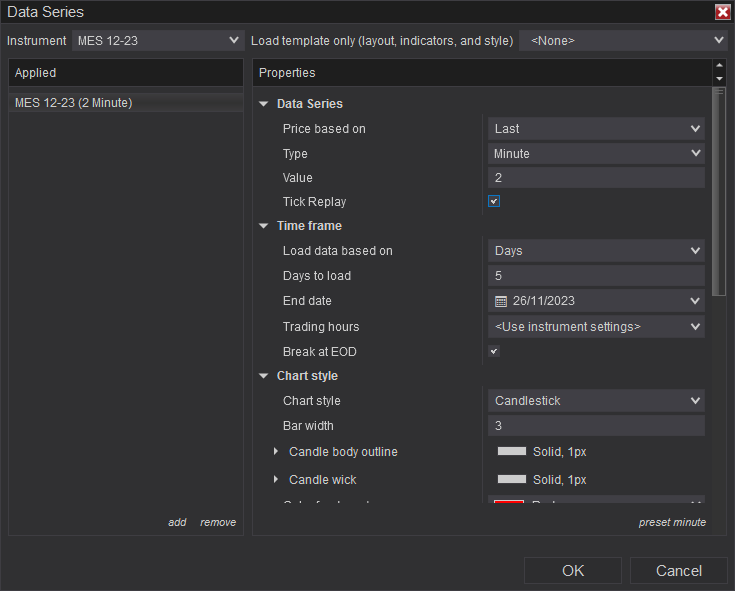
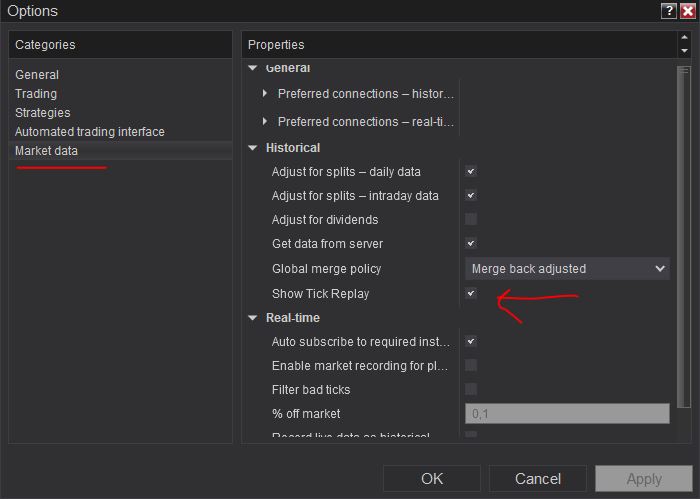
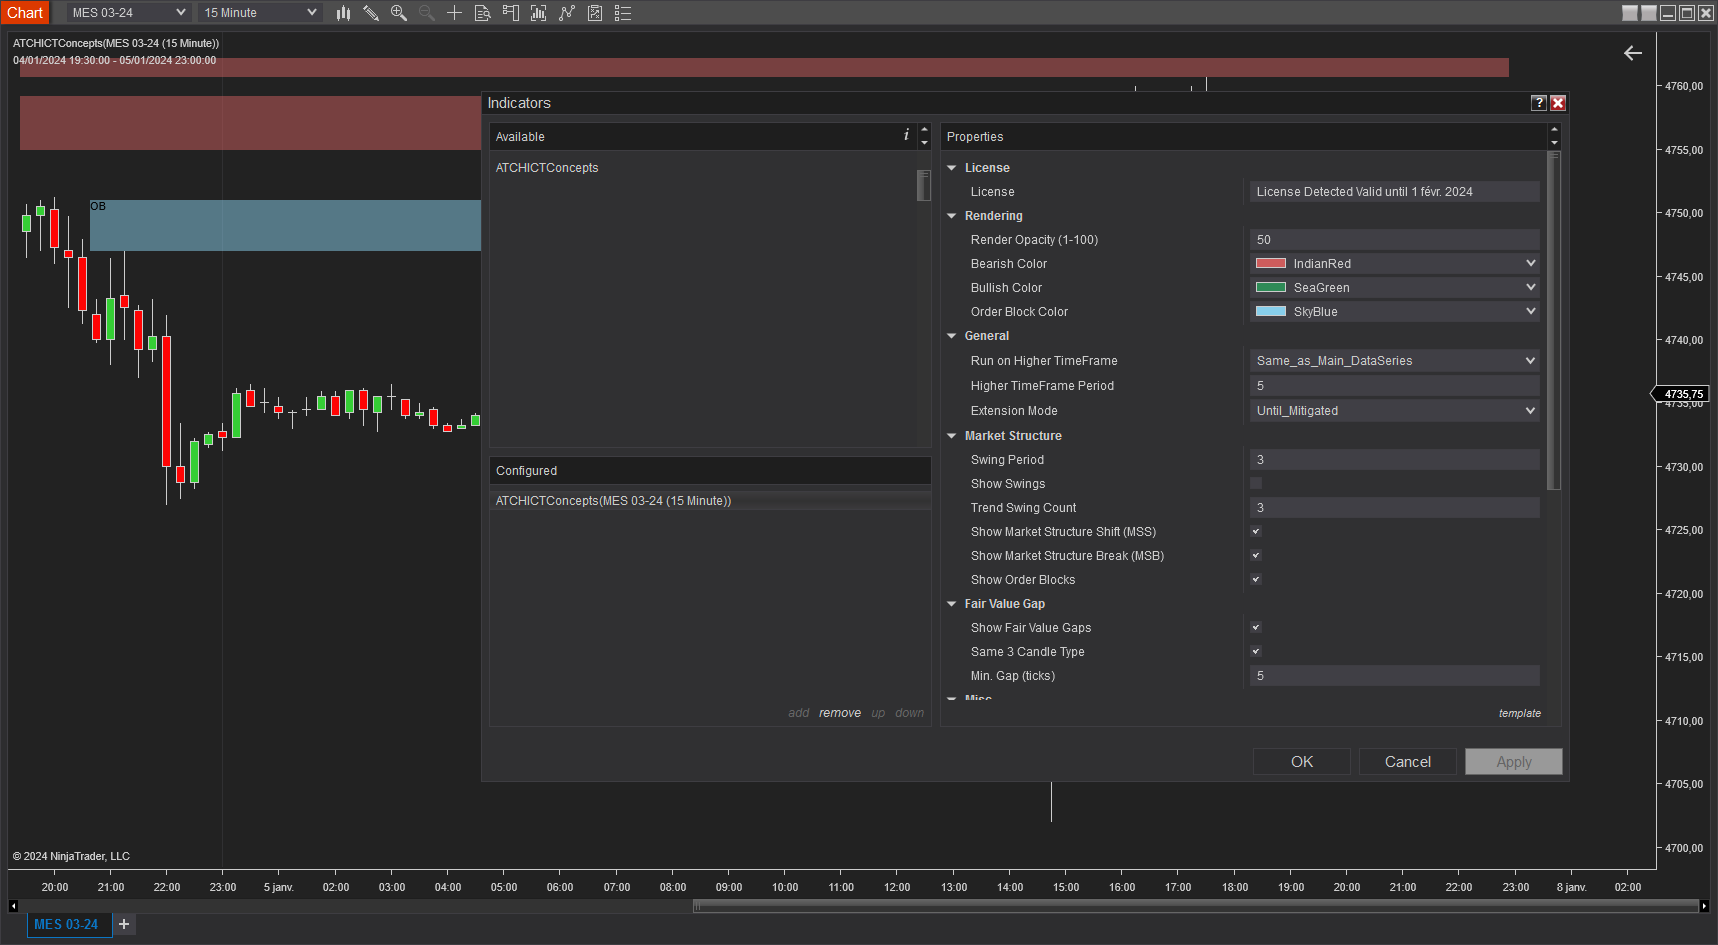
Installation Steps
Frequently Asked Questions
General
Release Notes
- Fix Bug: indicator hides Grid lines when added to chart
- Added Breaker Block sound alert
- Fix Opacity parameter not serialized/persisted
- Fix install error
- New FVG Filter parameter; Fixing Serialization of properties when saving templates; Modified higher timeframe enable/selection; Opacity of text enabled
- Fixed Breaker Blocks detection algorithm
- User Friendly parameter value options; Always drawing FVG label; Better Swing analysis; Added "Until Broken" extension mode; Better handling of empty license value; Added Breaker Blocks
- First Release of the indicator