Index
Prequisites
To use this indicator you should have available the following prequisites
- NinjaTrader 8. Click here to download
- Order Flow data is not required to use this indicator (you don't need to have a Lifetime license)
- automated-trading.ch account to obtain a free license key. To obtain the license key, simply Signup and then get your license on the billing page
Description
The Volume Profile indicator is a free NinjaTrader 8 indicator which has the following features
- Display of volume profile on each bar (or a period of bars)
- Display of volume profile on each trading session with an optional time interval settings
- Calcuation and display of value area on each volume profile
- Split of volume profile clusters interactively with a mouse click
- Merge and grouping (composition) of volume profile interactively with a mouse click
- Unique Auto Composition of volume profiles based on value area overlapping
- Works Seamlessly with or without OrderFlow Data or Tick Replay
- Works Seamlessly on any timeframe including Renko Bars
- Precise visualization of Price Discovery and Balances areas
We highly recommend joining our discord community by following this invite link
![]()
Examples
Here are few examples of the indicator in action:
The most basic usage of the indicator is to display volume profiles on each bars on the chart. The volume profiles will show value areas calculated on a parametrizable percentage. The confluence between the value area bounds, the open and close prices and the point of control of the bar can show opportunities for short term scalping
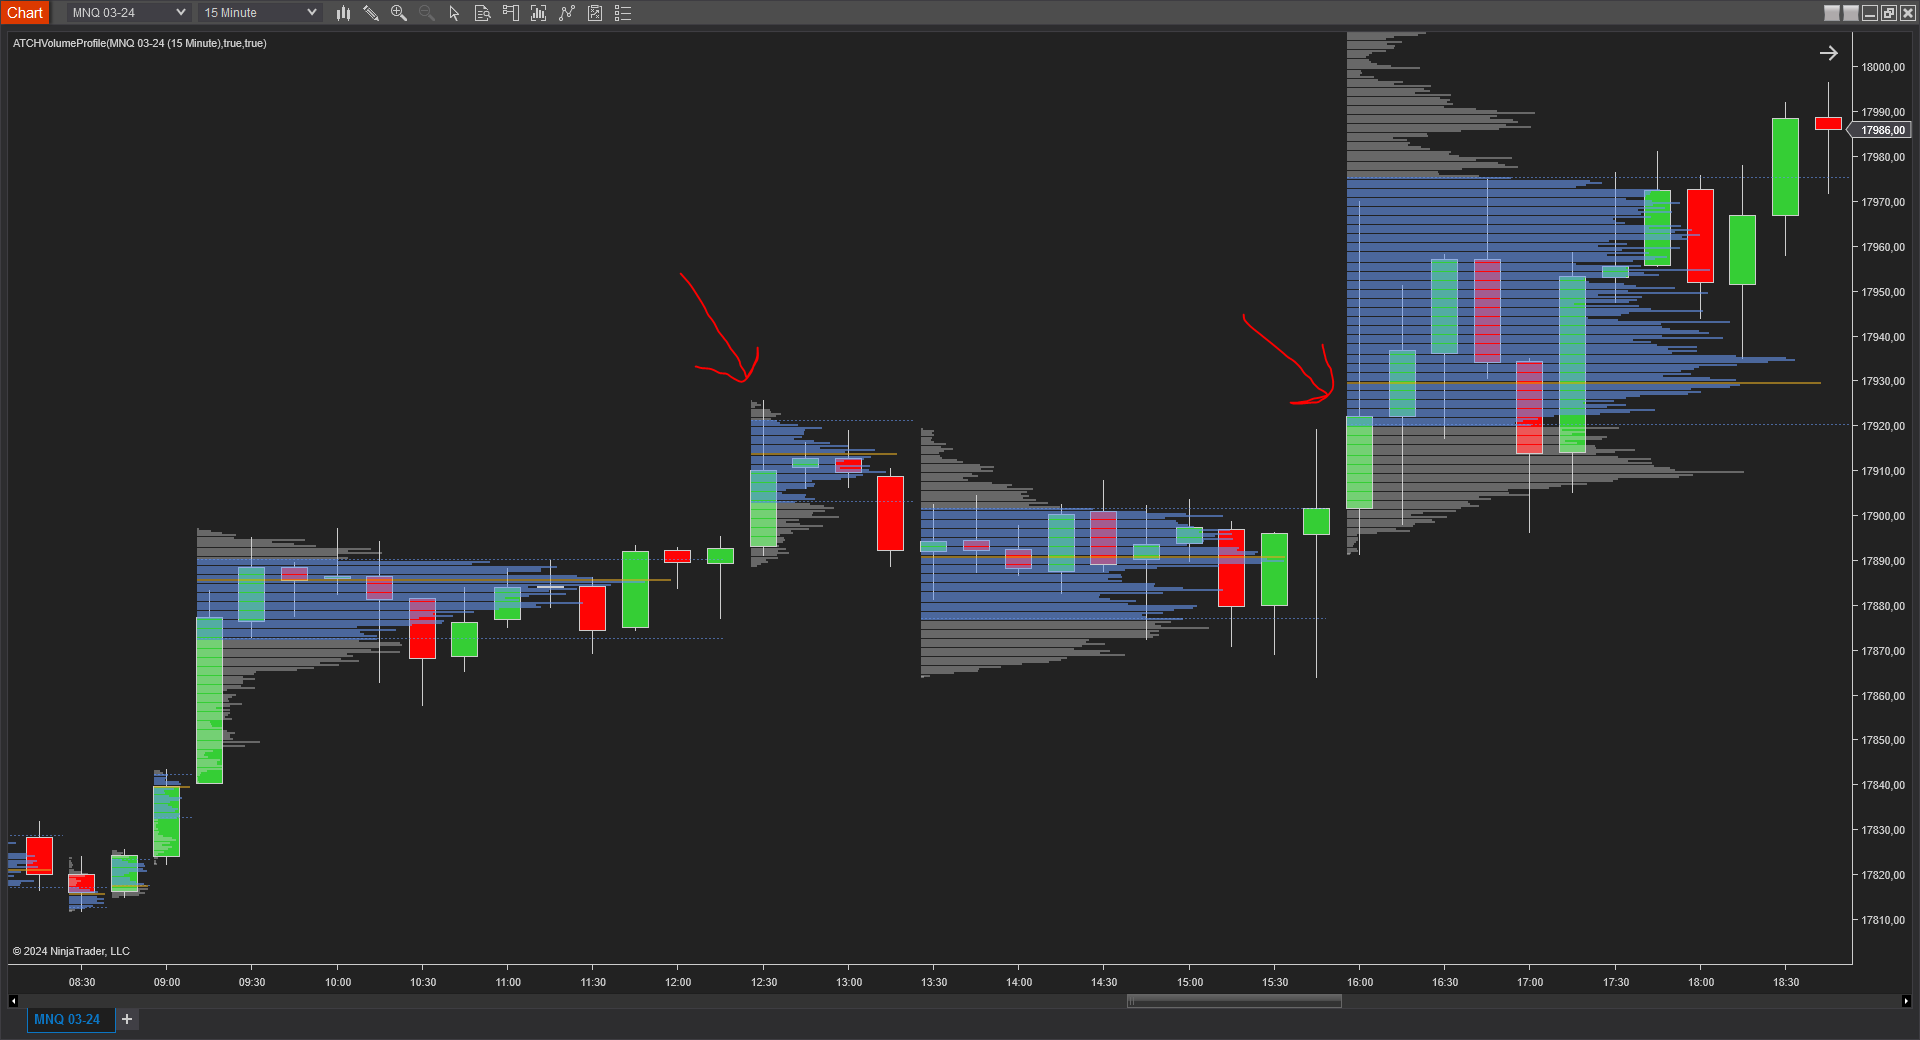
In this example, where the Auto Merge feature is enabled, you can see that the indicators was able define price ranges based on volume activity on each range
This automatic range detection feature allows to generate range breakout signals when a bar breaks out long or short from the last range formed. As you can see on the example chart, the red arrows point to two candles where the price breaks out of the Balanced region and started trending long
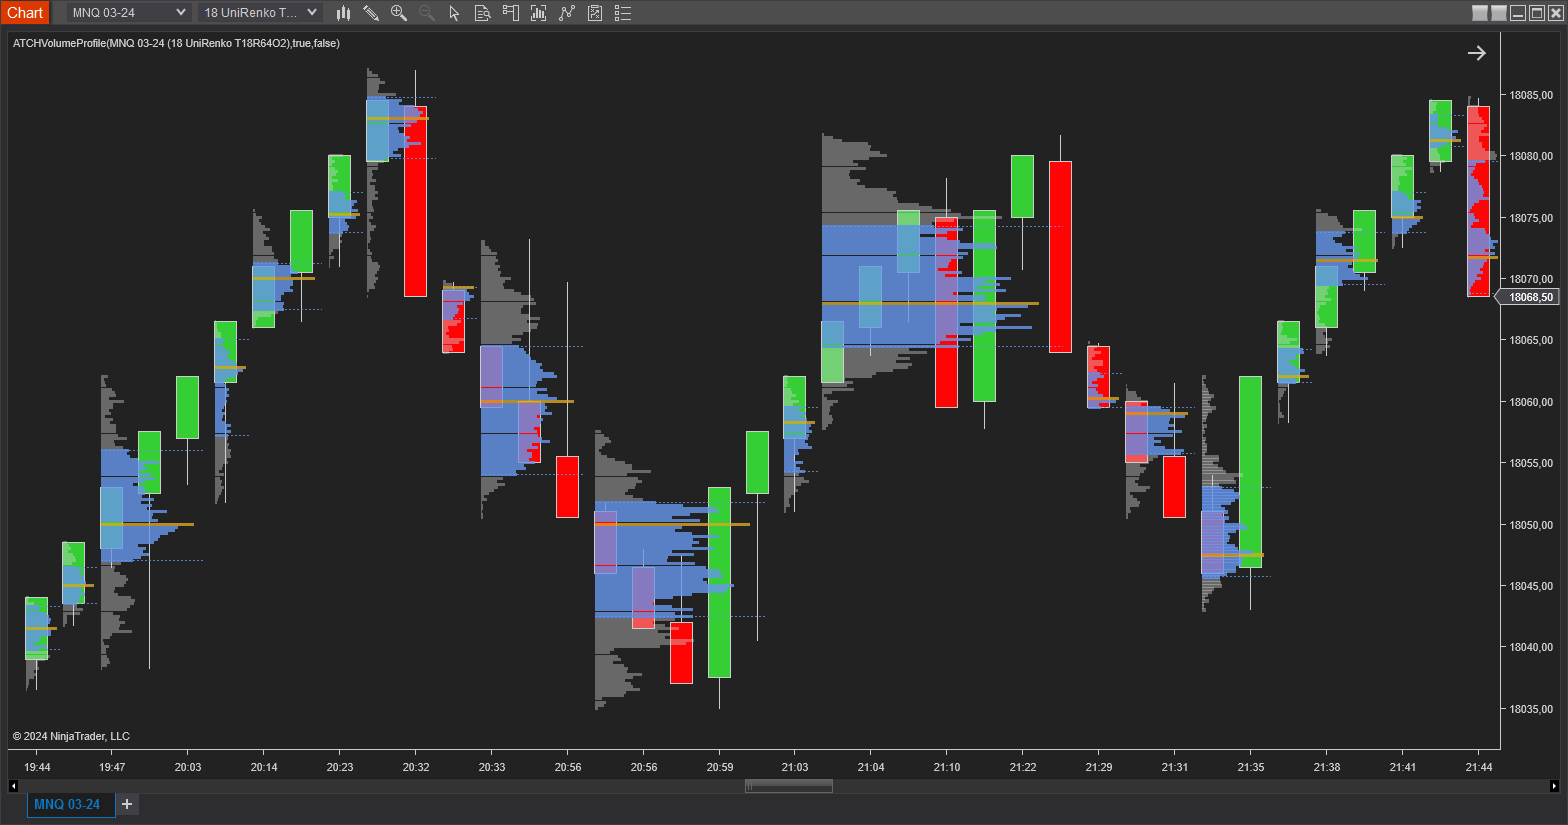
The built-in NinjaTrader 8 OrderFlow Volume Profile indicator is great but has limitations. One of its limitations is that it can't be used on Reno Charts, and it can't be used if you don't have the Lifetime NinjaTrader license which is a bit costly. Our Volume profile indicator desn't have these limitations. It is a free indicator that can be used even if you don't have OrderFlow data enabled on your Ninjatrader platform. And it works on both regular candlestick charts and on any type of renko charts.
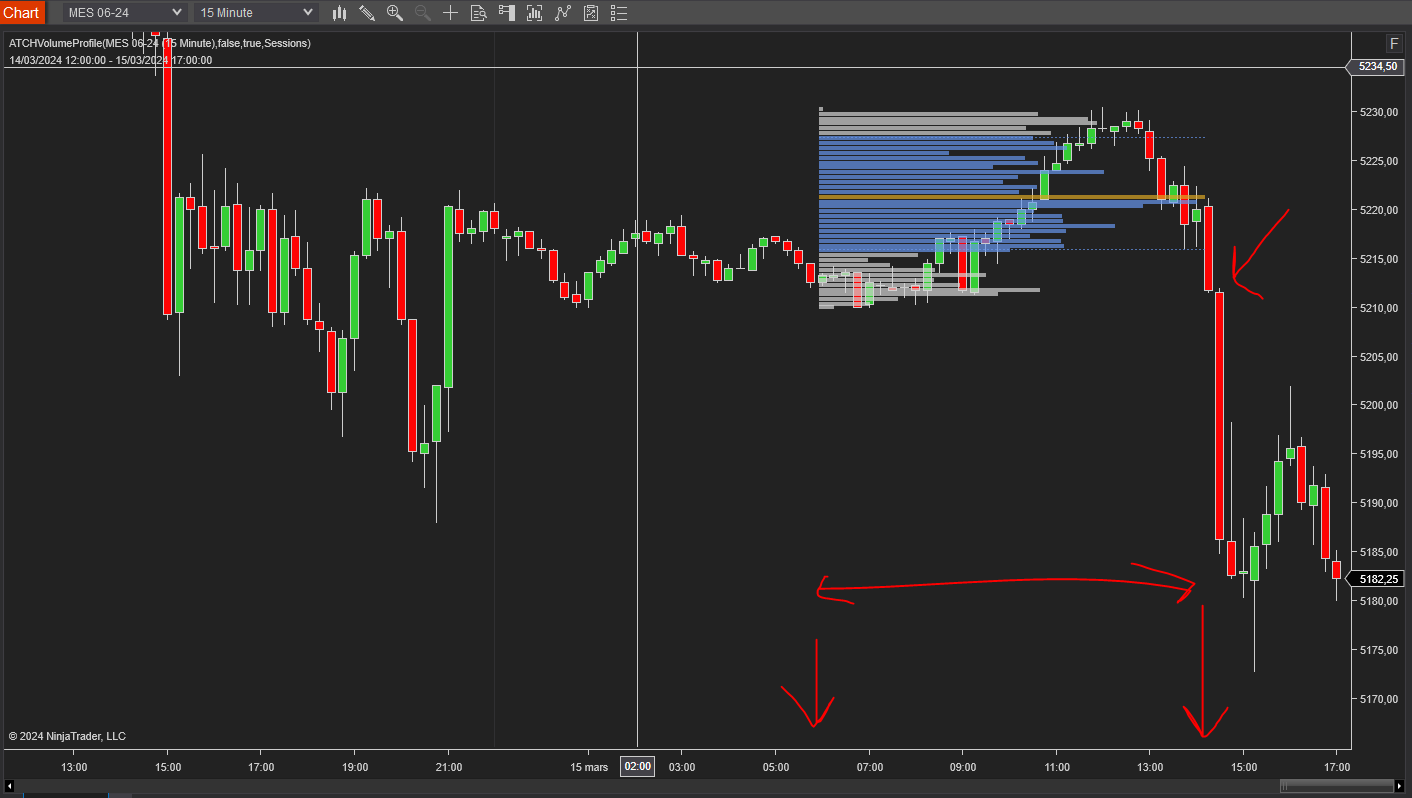
One trading strategy that can be built on the Session based volume profile is an opening range strategy
In this strategy, a volume profile is calculated between 01 AM and 09 AM Eastern Time, 30 minutes before market open. This volume profile defines a range between its value area levels
When the price breaks from the range defined by the value area levels one can follow the breakout and enter long or short.
You can see on the image above the strategy in action.
Parameters
We always try to keep the parameters to minimum.
| License | |
| License | This is the free license key you get when you create an account on automated-trading.ch. After creating an account, copy your license key from the billing page. You need to set this parameter only once per month, once the license key is validated it will be remembered for the rest of the billing cycle. |
| General | |
| Use OrderFlow Data | This parameter tells the indicator if you have OrderFlow data enabled (NinjaTrader Lifetime license) or not. You should check this if you have OrderFlow. And uncheck it if you don't have OrderFlow data, in which case you should enable TickReplay on your chart for the indicator to work properly |
| Align |
This parameter sets the drawing alignment of the profiles on the chart
|
| Width % | This parameter sets the profile width in percentage of the total with of the candle bars(s). The value of 100 will fill the whole area. |
| Profile Period |
This parameter sets the profile period type. It can have two possible values
|
| Bars Period | This parameter is only available when the Bars value is selected for the Profile Period parameter. This parameter sets the number of bars for one volume profile. If you set this value to 1, the indicator will draw a profile for each bar. If you set this to 2, the indicator will draw one volume profile for each couple of bars. Notice that you can merge or split bars manually which will affect this initial clustering period |
| Time Zone |
This parameter sets the time zone to be used for setting the Session Interval parameter below. Since futures markets are open and closed based on US market time zone which is EST (US Eastern, New York), this parameter allows you to specifiy trade time interval on another timezone which is your local machine timezone
|
| Session Interval (hh:mm-hh:mm) | This parameter is only available when the Sessions value is selected for the Profile Period parameter. This parameter sets the time interval that defines the trading session. For example if you want to draw a volume profile on the RTH session, the value of this parameter should be "09:30-16:15" |
| Ticks Per Level | This parameter sets the option to group multiple ticks er level. which can provide a more accurate representation of the market activity at each price level. When volume data is grouped per level, the indicator aggregates the volume for each price level, rather than showing each individual tick. This can be especially useful in markets with high trading volumes such as the nasdaq (NQ or MNQ) |
| Value Area % | This will set the percentage used to calculate the Value Area of profiles. The value area is the area in which x% of trading volume occured. The standard value for this is 68% which represents the value are of a Normal distribution. But you can set this to other values such as 40%, in this case the value area will be calculated, on each new price tick, to show the price levels that represent 40% of the total volume of the profile. The value are is the area around the POC (Point of Control) which is the price level having the maximum traded volume |
| Auto Merge Profiles | This will enable/disable the automatic composition of adjacent profiles based on the overlapping of their value areas. This can be useful to automatically detect ranges of balance, and when the price breakout of those ranges in price discovery mode. Those two events can build the foundation of a trading strategy based on market auction theory |
| Rendering | |
| Profile Opacity | The opacity to render the body of the profile. I personally set this value to 40 |
| Value Area Opacity | The opacity to render the value area of the profile. In general you would want to set this to a slightly higher value than the body opacity to create a clear contrast between the two areas |
| Profile Body Color | Draw Color of profile levels other than the POC and value area levels |
| POC Color | Draw Color of the POC level (point of control) |
| Value Area Color | Draw Color of the value area levels |
| Show POC | Enable/Disable highlighting the POC level with its own color |
| Show Value Area | Enable/Disable highlighting the value area levels with their own colors |
| Show Labels | Enable/Disable showing pivot levels labels |
| Font Size | This sets the font size of the labels if they are enabled |
Interactive Commands
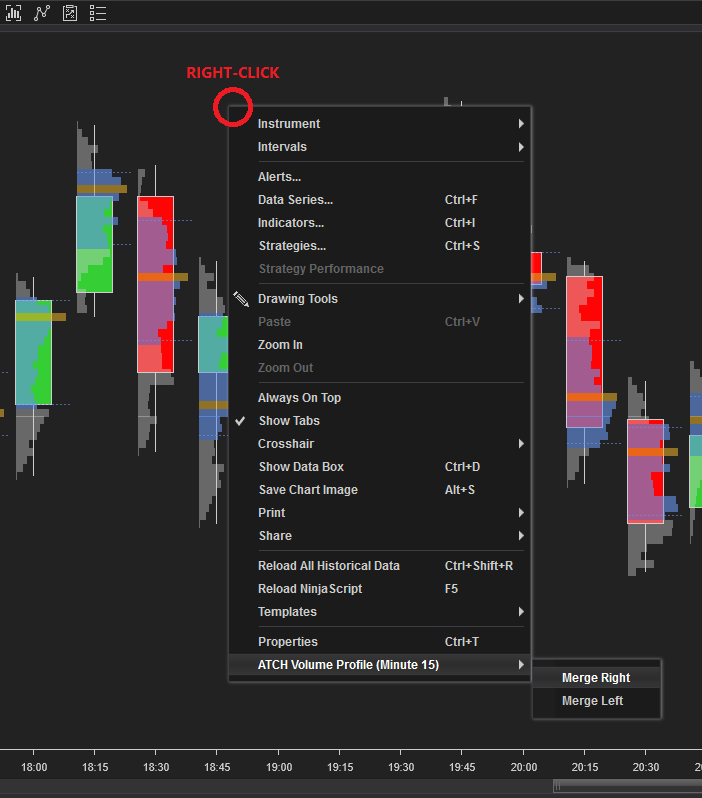
Interactive commands are operations of merge/split that can be applied to volume profiles on the chart by right-clicking on them
| Merge Right | |
|
This command is accessible on Right-Click on the chart on a Volume profile item. If the clicked profile has a successor profile, this Context-menu button will be visible and you can click it to merge the selected profile with its right-hand profile. The result of this merge will be the concatenated profile from the two profiles. Profile before merge: 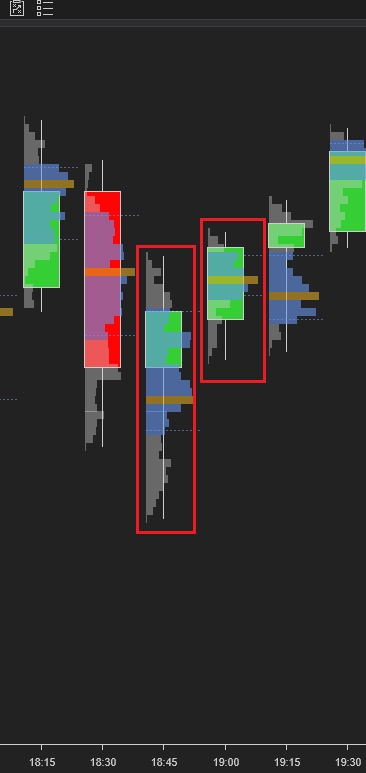
Profile after merge: 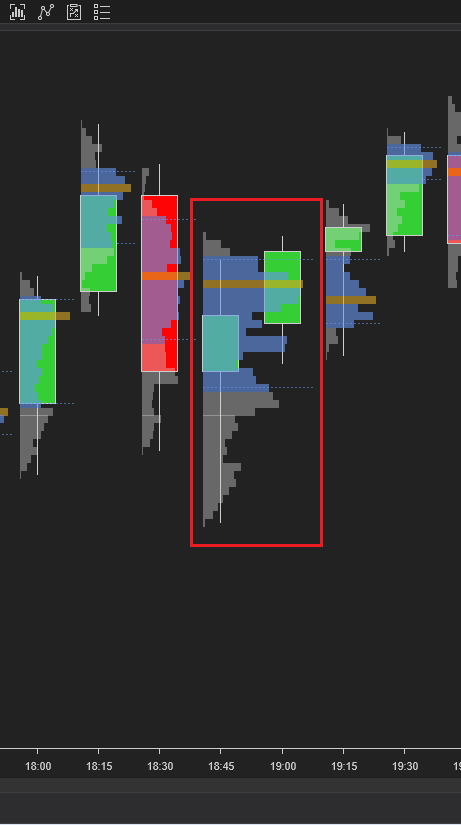
The resultant composite profile can be further composed with its right or left profiles |
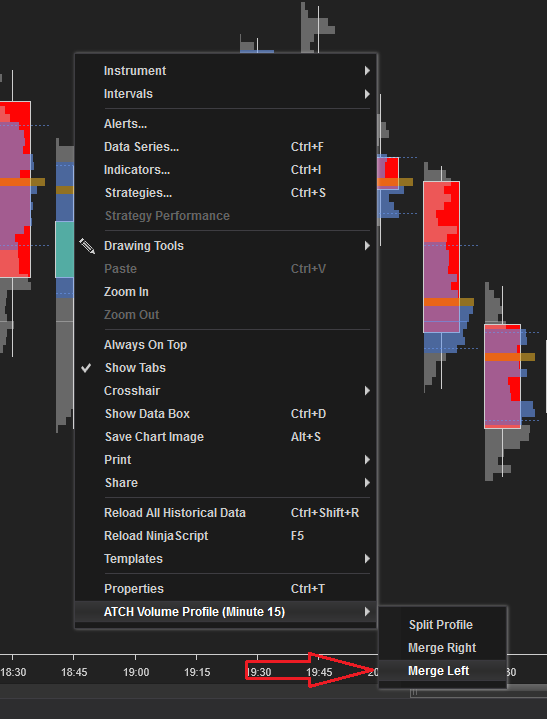
| Merge Left | |
|
This command is accessible on Right-Click on the chart on a Volume profile item. If the clicked profile has a prdecessor profile, this Context-menu button will be visible and you can click it to merge the selected profile with its left-hand profile. The result of this merge will be the concatenated profile from the two profiles. The resultant composite profile can be further composed with its right or left profiles |
| Split Profile | |
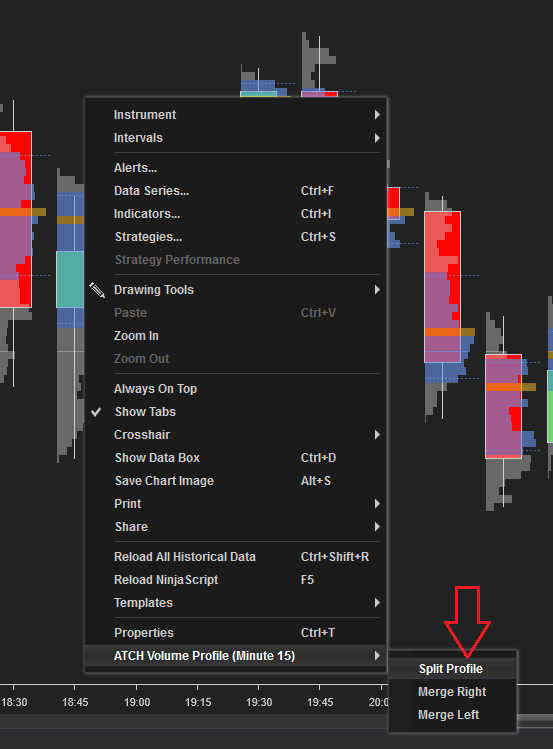
|
This command is accessible on Right-Click on the chart on a Volume profile item. If the clicked profile is composed of more than one candlestick, this Context-menu button will be visible and you can split the selected profile into multiple unit profiles. The split profiles can be re-merged afterwards. |
Download & Installation Instructions
The indicator can be downloaded for free. To download and install the indicator follow the instructions below
- Click on the below download button to download the Volume Profile Indicator file
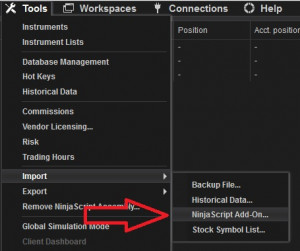
- Import the downloaded .zip file into NinjaTrader using the import NinjaScript menu item
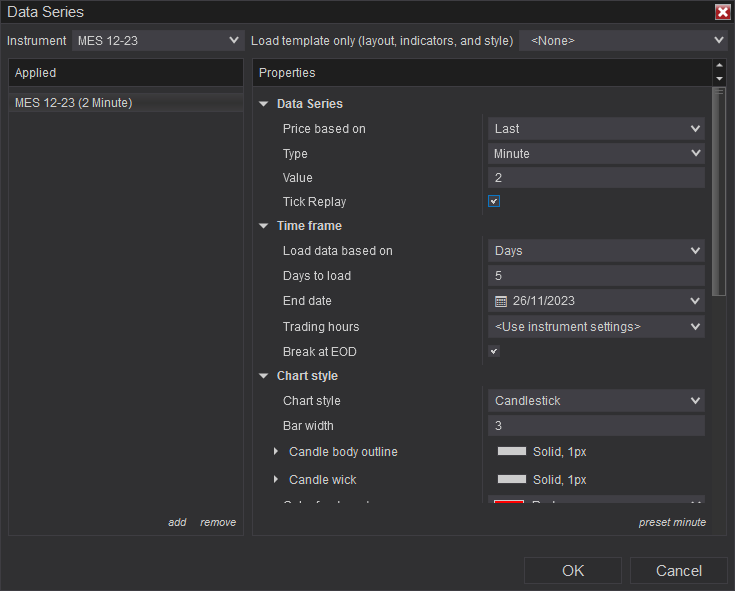
- Next, open a new chart window
- In case you intend to use the indicator without OrderFlow data (Ninjatrader Lifetime License), you should enable the Tick Replay. In this case, on the new chart settings, make sure you enable the Tick Replay check box
- If OrderFlow data is enabled on your NinjaTrader License, than the indicator will work seamlessly with or without Tick Replay, You just need to make sure to check the Use OrderFlow Data parameter
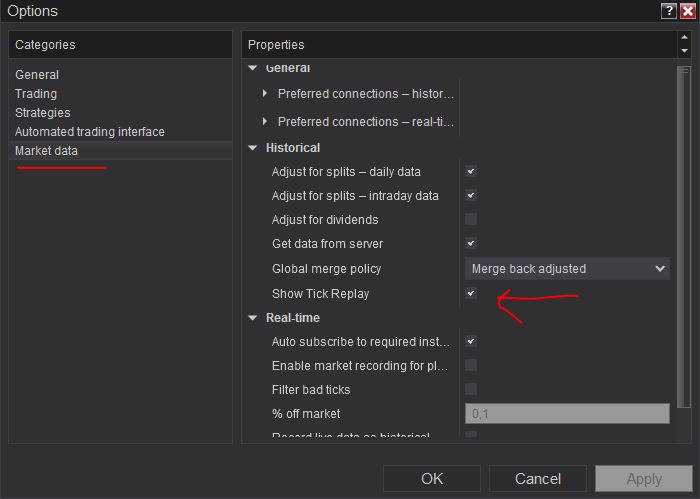
- If you don't see the Tick Replay check box, go to Tools->Options->Market Data and enable Show Tick Replay
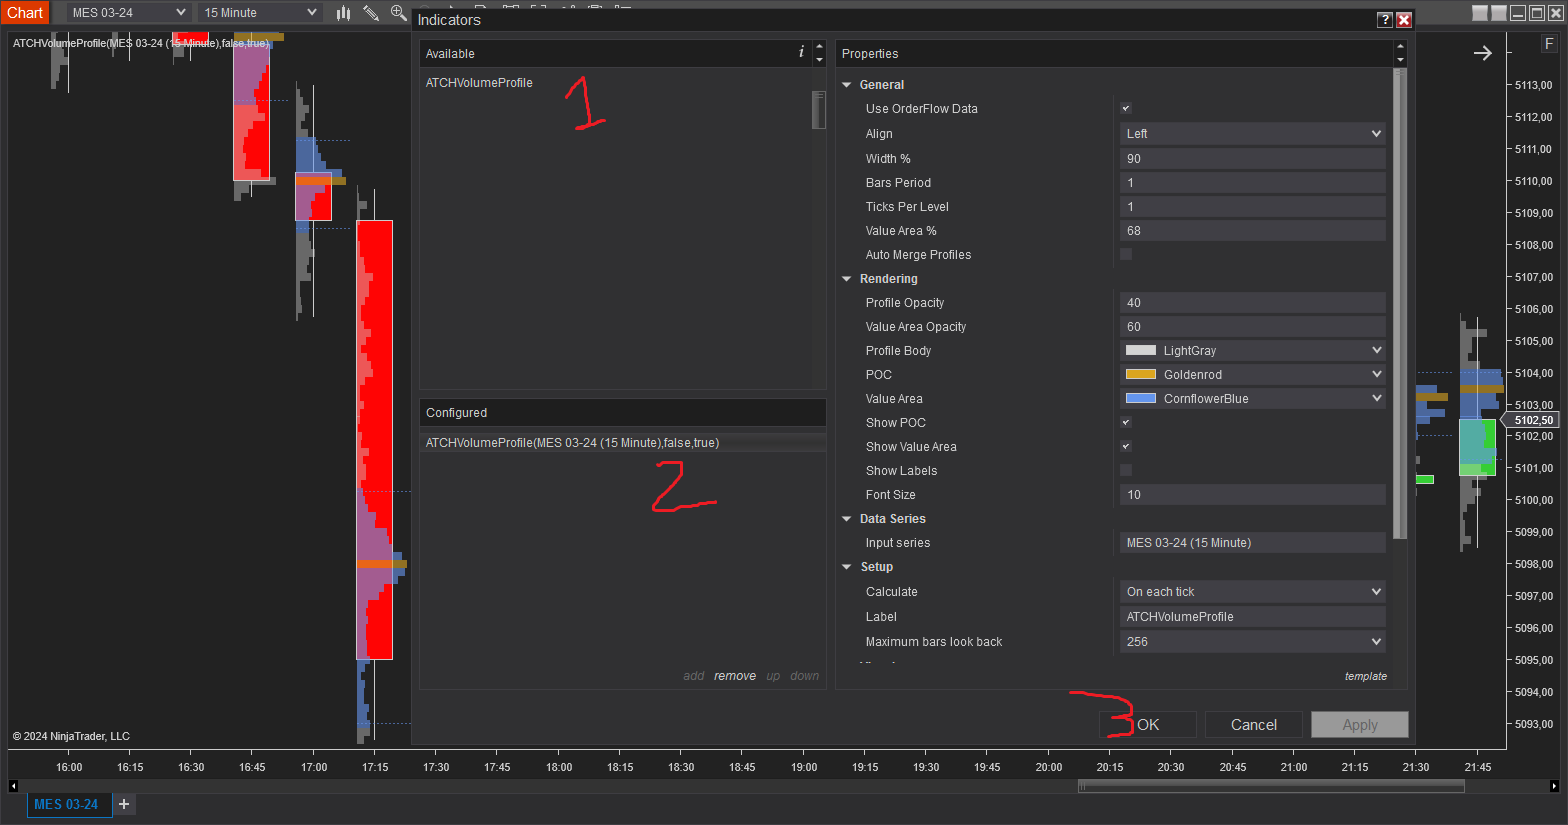
- After installing the indicator and opening a new Chart window you should add the indicator to the chart. Right-click on the chart and click on Indicators...
- Copy/Paste your license key that you can find on the Billing page into the license parameter
- After adding the indicator to the chart, the indiactor will be run on Historical data loaded in the chart.
- After that, the indicator is added with success and will continue to run on live market data
Frequantly Asked Questions
General
Yes, If you have an idea that you believe can improve this indicator, I will be more then happy to hear from you. Please use the contact page to send me a message
No, the source code of the indicator is protected for copyright reasons
No, this indicator only do rendering and doesn't provide data that can be used from within a strategy. Check out our strategies for a Volume profile based strategy
Yes you can use this indicator without TickReplay if OrderFlow is enabled on your NinjaTrader platform
Release Notes
- Fix Bug : Fix error related to calculating Value Area on condensed profile
- Fix Drawing of profile on higher ticker per level values
- Fix Bug : crash while calculating value area on aggregated profile
- Fix lagging issue on NQ and MNQ by optimizing algorithms
- Change POC and Value area line drawing to Solid instead of dashing
- Fix a glitch on session mode when session intervals are very close to each other
- Rewrite of rendering algorithm fixing glitch, blinking and lag issues previously occuring on NQ and MNQ
- Bug Fix : License was generating a "License not recognized error" even though is recognized
- Bug Fix : Session mode is completely rewritten and is now bug free. Sessions can span midnight and new algorithm can handle special holiday days
- Refresh Rate is removed
- Refresh Rate is applied to drawing on chart rather than calculations
- Added EST, Local Time Timezones options for session based profiles
- Added new parameter Min Refresh Rate (Seconds) to control refresh rate for better performance on volatile instruments such as NQ
- More performance optimization by not calculating Value Areas when they are not shown
- Better license management
- Fixing Serialization of properties when saving templates
- Fix detecting of start and end of session
- First Release of the indicator
User Comments & Feedback
You can find feedback of our users and ask questions about this strategy by joining our discord community by following this invite link or clicking on the Discord logo image. Joining is completely free
![]()