Index
Prequisites
To use this indicator you should have available the following prequisites
- NinjaTrader 8. Click here to download
- automated-trading.ch Account with Premium Subscription
We highly recommend joining our discord community by following this invite link
![]()
Description
The ICT Concepts Indicator[Advanced] is a premium NinjaTrader 8 indicator which displays key concepts of the ICT trading methodology and style. Those key concepts are the following:
- Change of strucutre (or Change of Character or Market Structure Shift) that indicates that the trend might change
- Break of Strucutre (or Market Structure Break) that indicates a continuation of the trend
- Faire Value Gaps which represent displacements of price and are defined as instances of inefficiencies or imbalances visualized by three consecutive candles containing one large middle candle whose bordering candles' upper and lower wicks do not overlap.
- Volume Imbalance (VIB) which are price voids created when market momentum causes rapid price movements, leaving empty space between candle bodies that act as market magnets
- Gap Imbalance (GIB) which represents a more powerful form of imbalance when no wick closes through a gap, indicating an even stronger market inefficiency
- Order Blocks which represent crucial support and resistance levels derived from aggresive price movement, and that can be used as entry or exit levels
- Immediate Rebalances which represents price regions that represent No Inefficiencies nor Imbalances and no gap that the price need to return to.
- NWOG (New Week Opening Gap) which is the price gap between Friday's closing price and Sunday's opening price
- NDOG (New Day Opening Gap) which is the price gap between yesterday's closing price and Today's opening price
- RTHG (Opening Range Gap) which marks the distance between the first opening tick of a session and the previous session's close
- Interactively control and manipulate the ICT zones on the chart
- Multi-Timeframe capabilities
- New Features are planned to be added contineously
Examples
Change of Character (Market Structure Shift) and Break of Structure
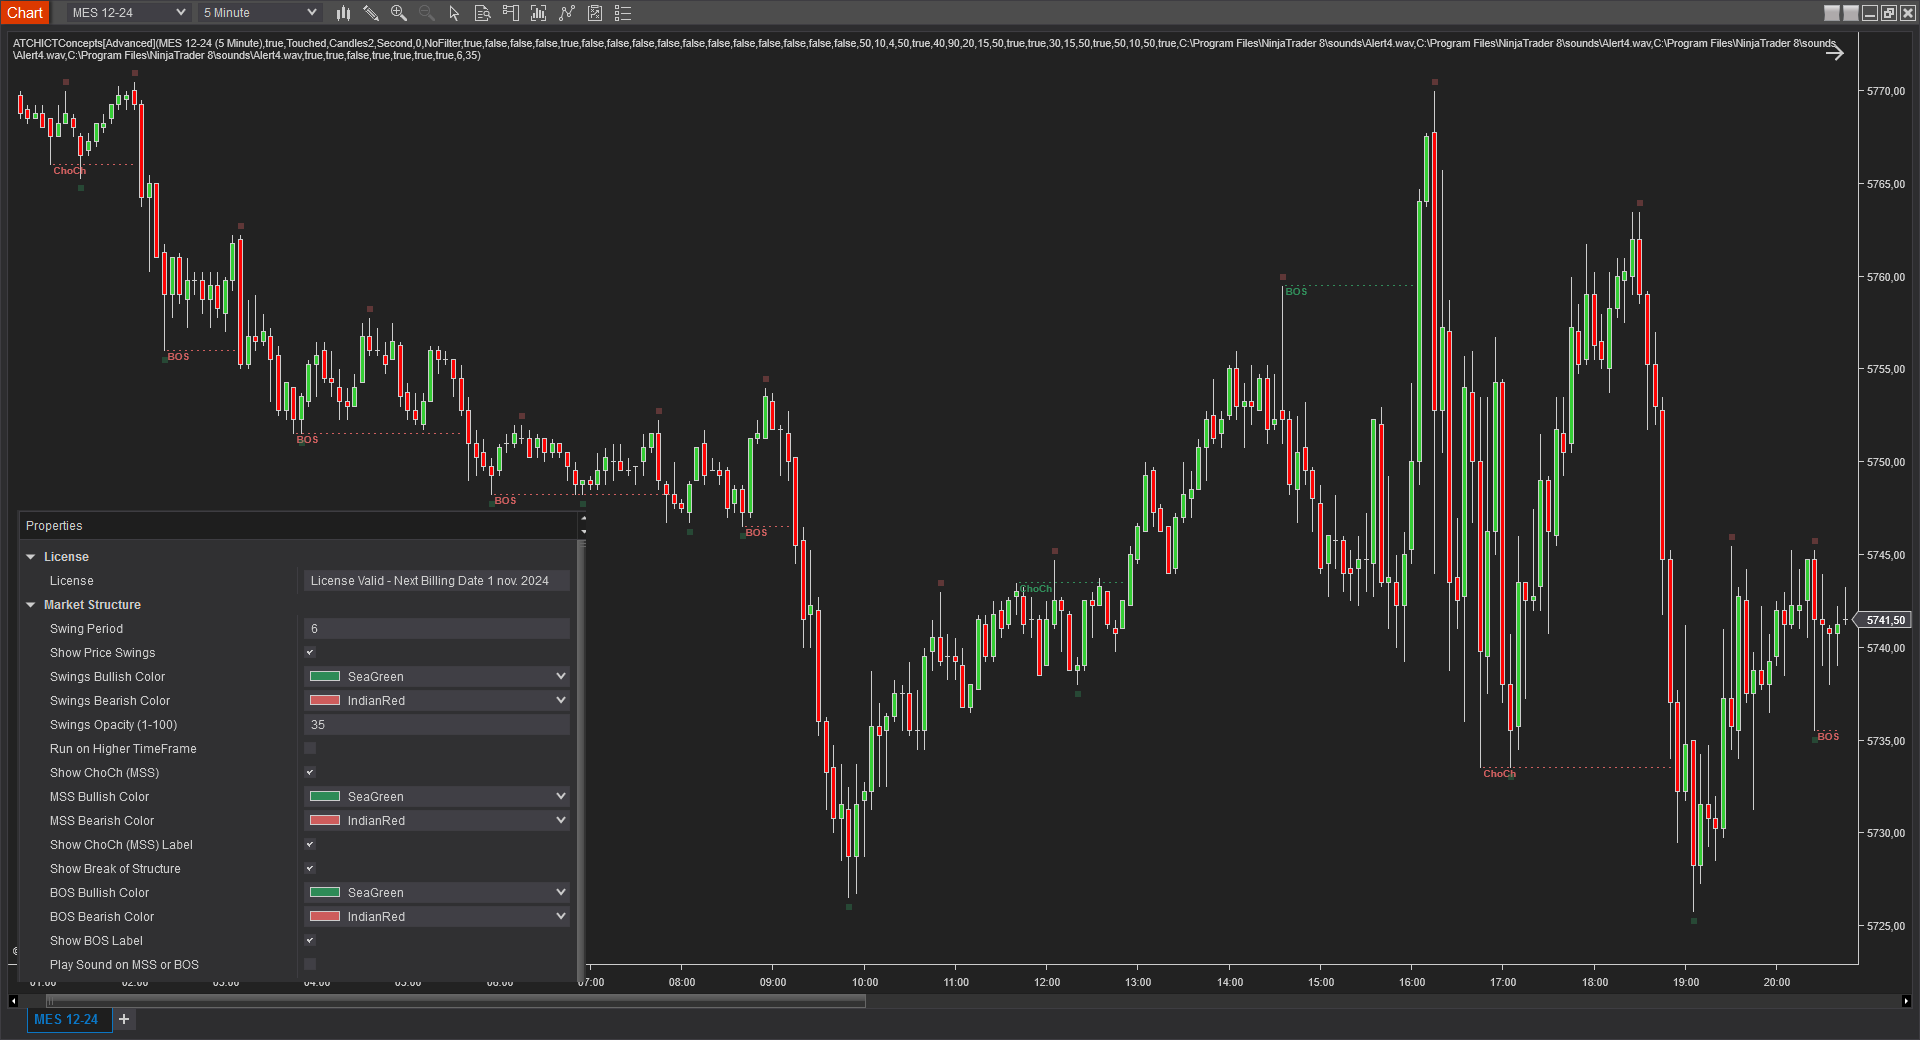
The market structure features of the indicator allows to draw the market structure shifts and break of structures. Market structure shifts are price breakouts indicating a probability of price changing dirction. On the other hand, Break of structure are price breakouts indicating a trend direction continuation. Those market structure events are building blocks of the ICT methodology and can be used as bias determinants and filters to go long or short.
Run Market Structure analysis on Higher Timeframe
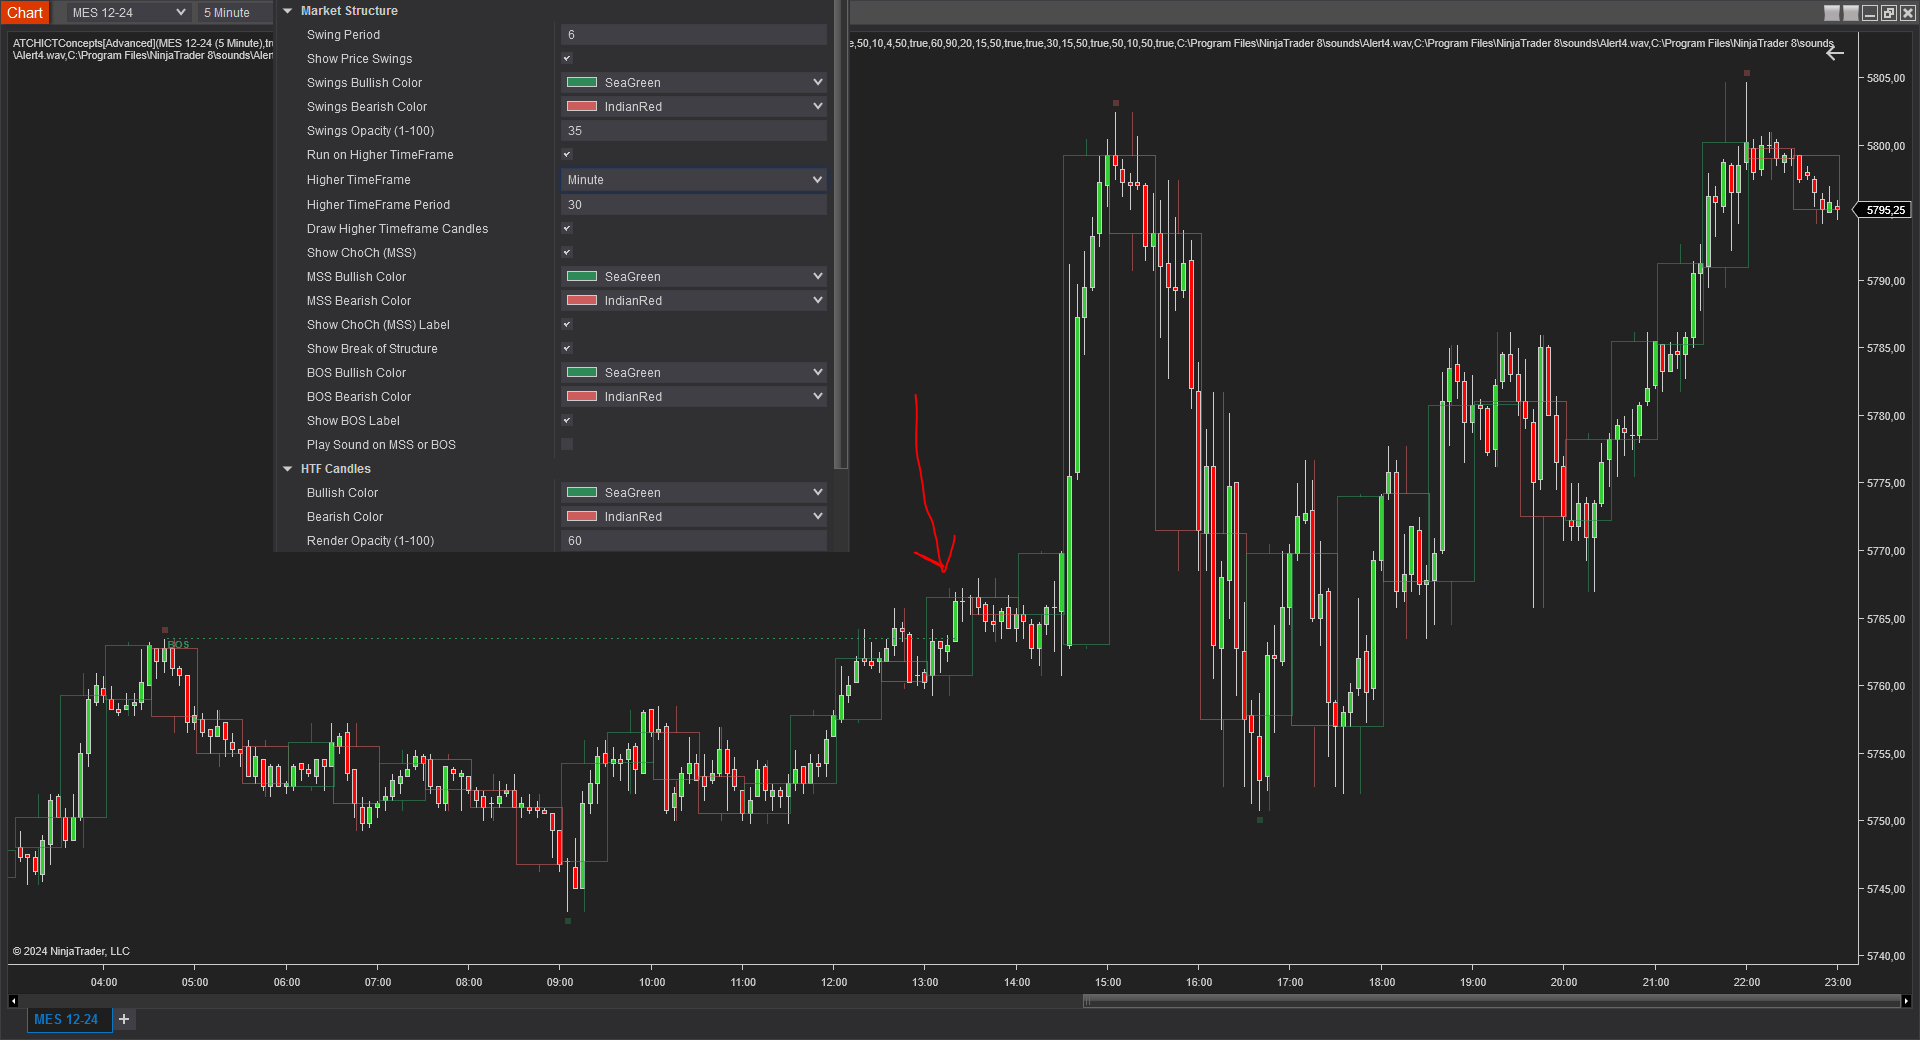
The indicator can be run on a higher timeframe to allow top-down analysis. In the above example you can see the indicator overlaying higher timeframe candles (30 Minutes) on top of the active chart candles (5 Minutes), and detecting a BOS (Break of structure) on the higher timeframe leading to a huge move upwards few minutes later. The BOS is detected on the candle where the Red arrow is drawn on the image
Fair Value Gaps
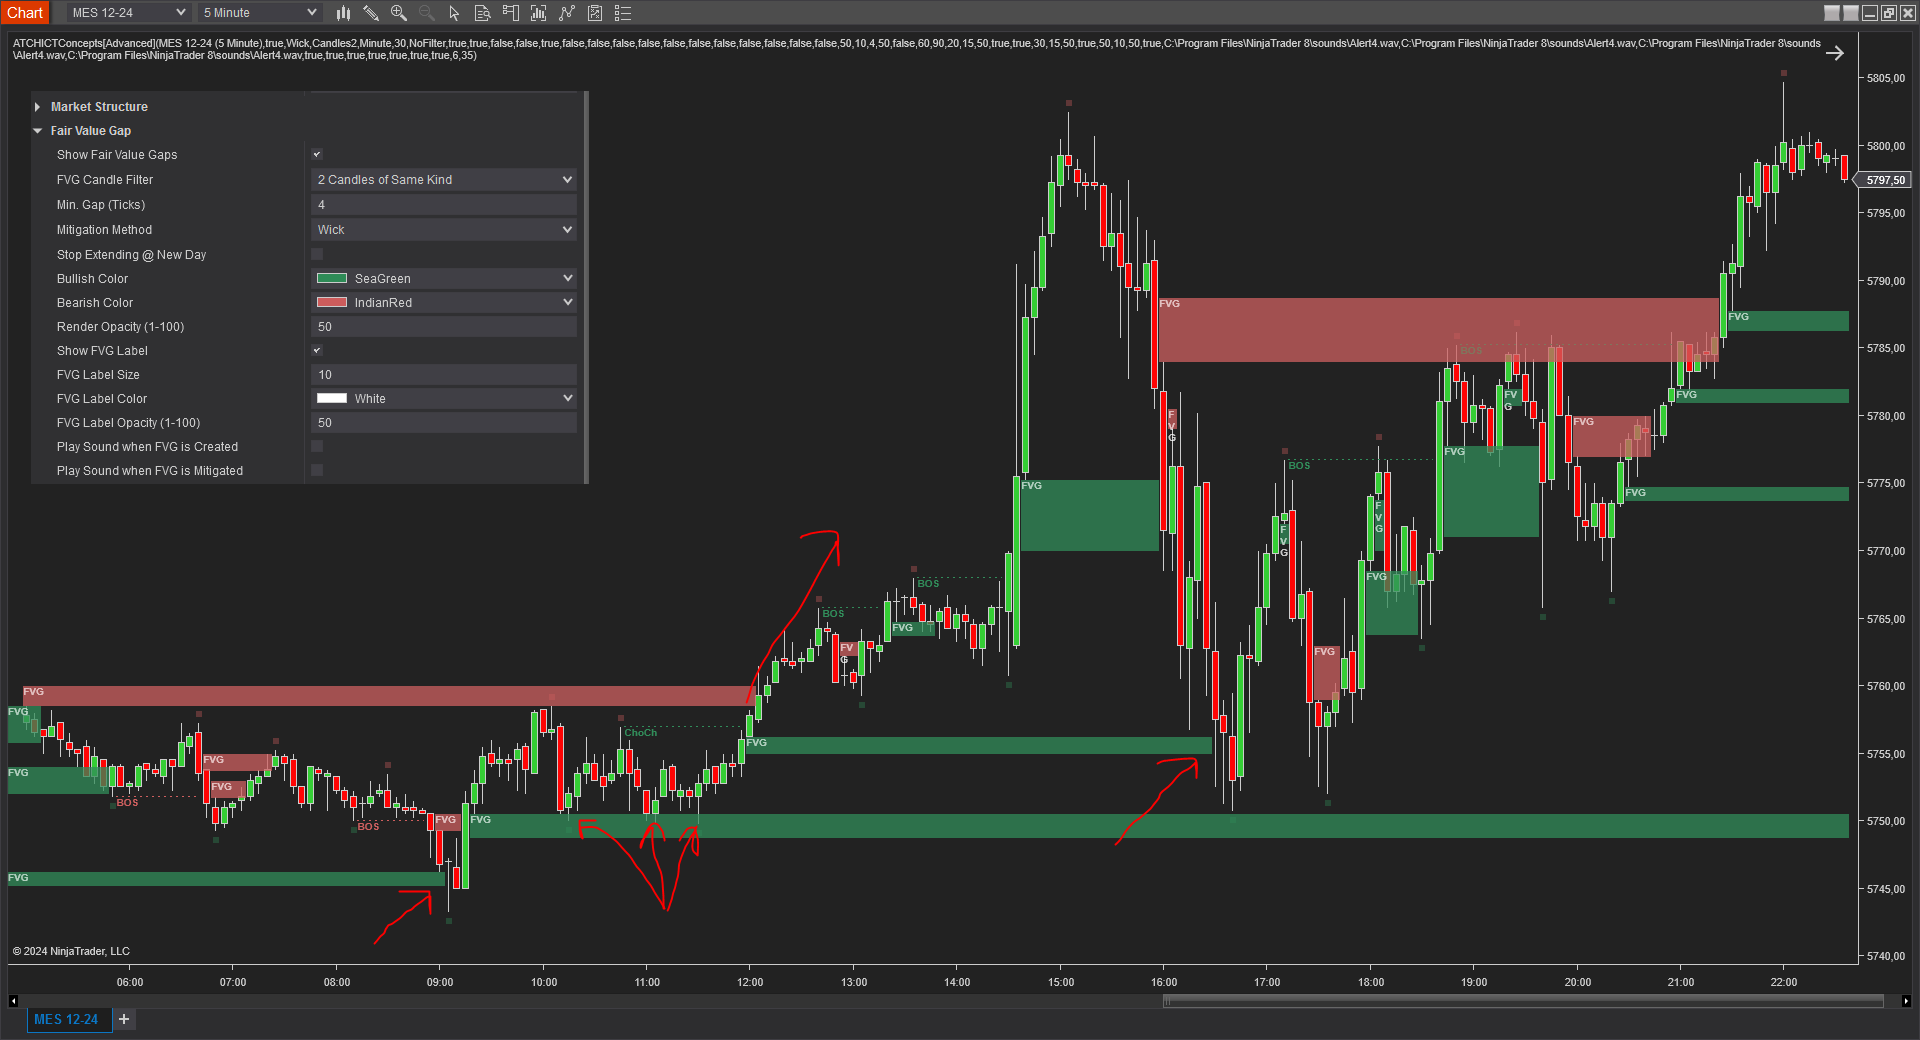
In this example, the indicator detects several Fair Value Gaps on the MES instrument on a 5 Minutes Timeframe. Coupled with MSS and MSB, FVGs can be a very good signal to enter a trade.
In this example, bullish FVGs are drawn in green, and bearish FVGs are drawn in red. Their drawing is stopped when they are mitigated.
Several entry setups are illustrated on the image above. The first one at 09:00, we can see a clear rejection of price after the bullish FVG been retested. This can be considered as an oppurtuniy to go long with a stoploss set at the swing low of the rejection candle
The second entry setup example is illustrated with the 3 touch points on the bullish FVG zone followe by a clear ChoCh price breakout and a new FVG formation. This can be used to enter long and a stoploss set below the first FVG lower level
The third example is very similar to the first one, a clear rebound on the FVG zone. The possibilities of using FVG zones to enter are infinite. And the more you use other ICT confluences to confirm your entry setups the more you end up with profitable trades
FVG analysis and detection can be run on higher timeframe if the Run on Higher Timeframe option is enabled, and the good part is that you can add multiple instances of the indicator on the same chart with different timeframes for an advanced multi-timeframe top-down analysis
Volume Imbalance (VIB)
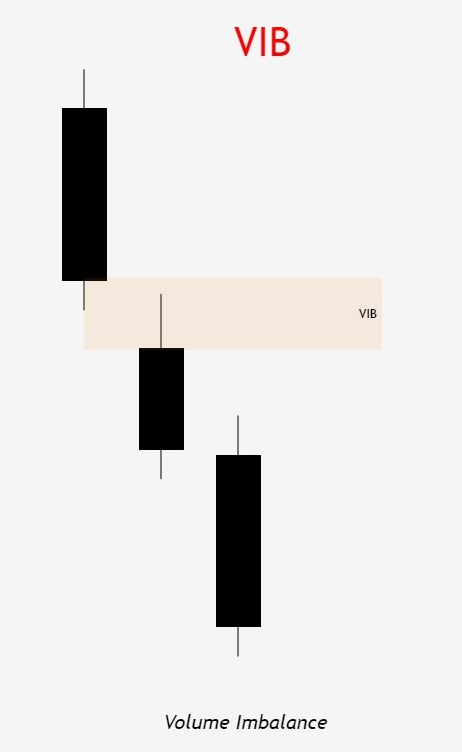
Volume Imbalance (VIB) occurs when the market moves with strong momentum, creating price voids between consecutive candle bodies. Unlike Fair Value Gaps which rely on specific three-candle patterns with non-overlapping wicks, Volume Imbalances form more rapidly during aggressive price movements as traders push price quickly through price levels.
Bullish Imbalance: A bullish imbalance forms when the open price of the second candle is higher than the close price of the first candle, leaving empty space between the two bodies. This void represents price that the market did not trade through due to strong buying pressure.
Bearish Imbalance: A bearish imbalance forms when the open price of the second candle is lower than the close price of the previous candle's body. This gap represents price levels that were skipped over due to aggressive selling pressure.
Market Structure Significance: Volume Imbalances act like market "magnets" because the market moved too quickly to fill those prices. Price typically revisits these areas to balance orders and provide liquidity before continuing a trend. These voids are areas of inefficiency that the market seeks to correct, making them valuable zones for both entry and exit strategies.
VIB zones can be traded similarly to FVGs by entering when price revisits and retests the imbalance zone, or by using them as additional confluence with other ICT concepts like Order Blocks or Market Structure events for enhanced trade setups.
Gap Imbalance (GIB)
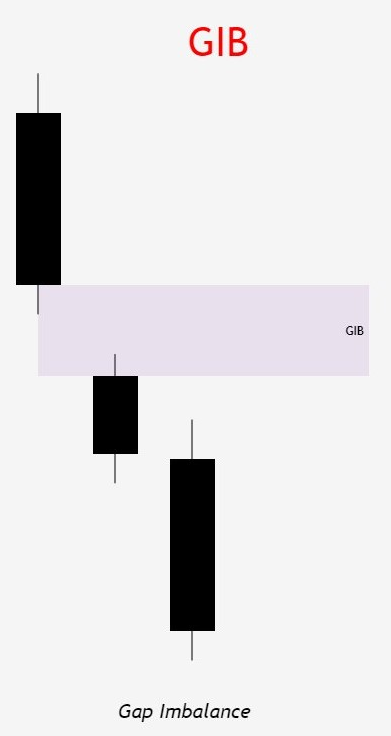
Gap Imbalance (GIB) follows the same principles as Volume Imbalance but with an additional and more restrictive condition: no wick can close through the gap. This stricter requirement creates an even more powerful market inefficiency indicator.
Formation Criteria: A Gap Imbalance forms when consecutive candles create a gap between their bodies, but neither candle's wick penetrates the opposite candle's body. This means the gap remains completely untouched by any price movement, representing pure and undisputed market imbalance.
Market Strength Indicator: The fact that no wick closes through a GIB zone indicates extremely strong directional momentum. The market moved with such force that it not only skipped price levels but also prevented any pullback wick from testing those levels. This makes GIBs a more aggressive and reliable imbalance signal compared to standard VIBs.
Trading Significance: GIB zones act as powerful magnets for price, as they represent areas where the market was unwilling to trade at all. These zones are typically revisited with stronger conviction than VIBs, making them valuable entry and exit points. When price revisits a GIB, it often does so with the same directional momentum that created it, providing trading opportunities with well-defined risk management through the zone boundaries.
Combining GIBs with Market Structure events and Order Blocks creates a high-confluence setup for disciplined traders looking for high-probability trade entries.
Order Blocks
Order Blocks are defined as zones created from the last high swing candle (for bearish) or the last low swing candle (for bullish) before a Market Structure Shift or a Break of Structure. Add to this some other rules:
- The candle defining the Order Block should be followed by an FVG
- The Order Block zone should not be mitigated before the breakout creating the Market Structure event
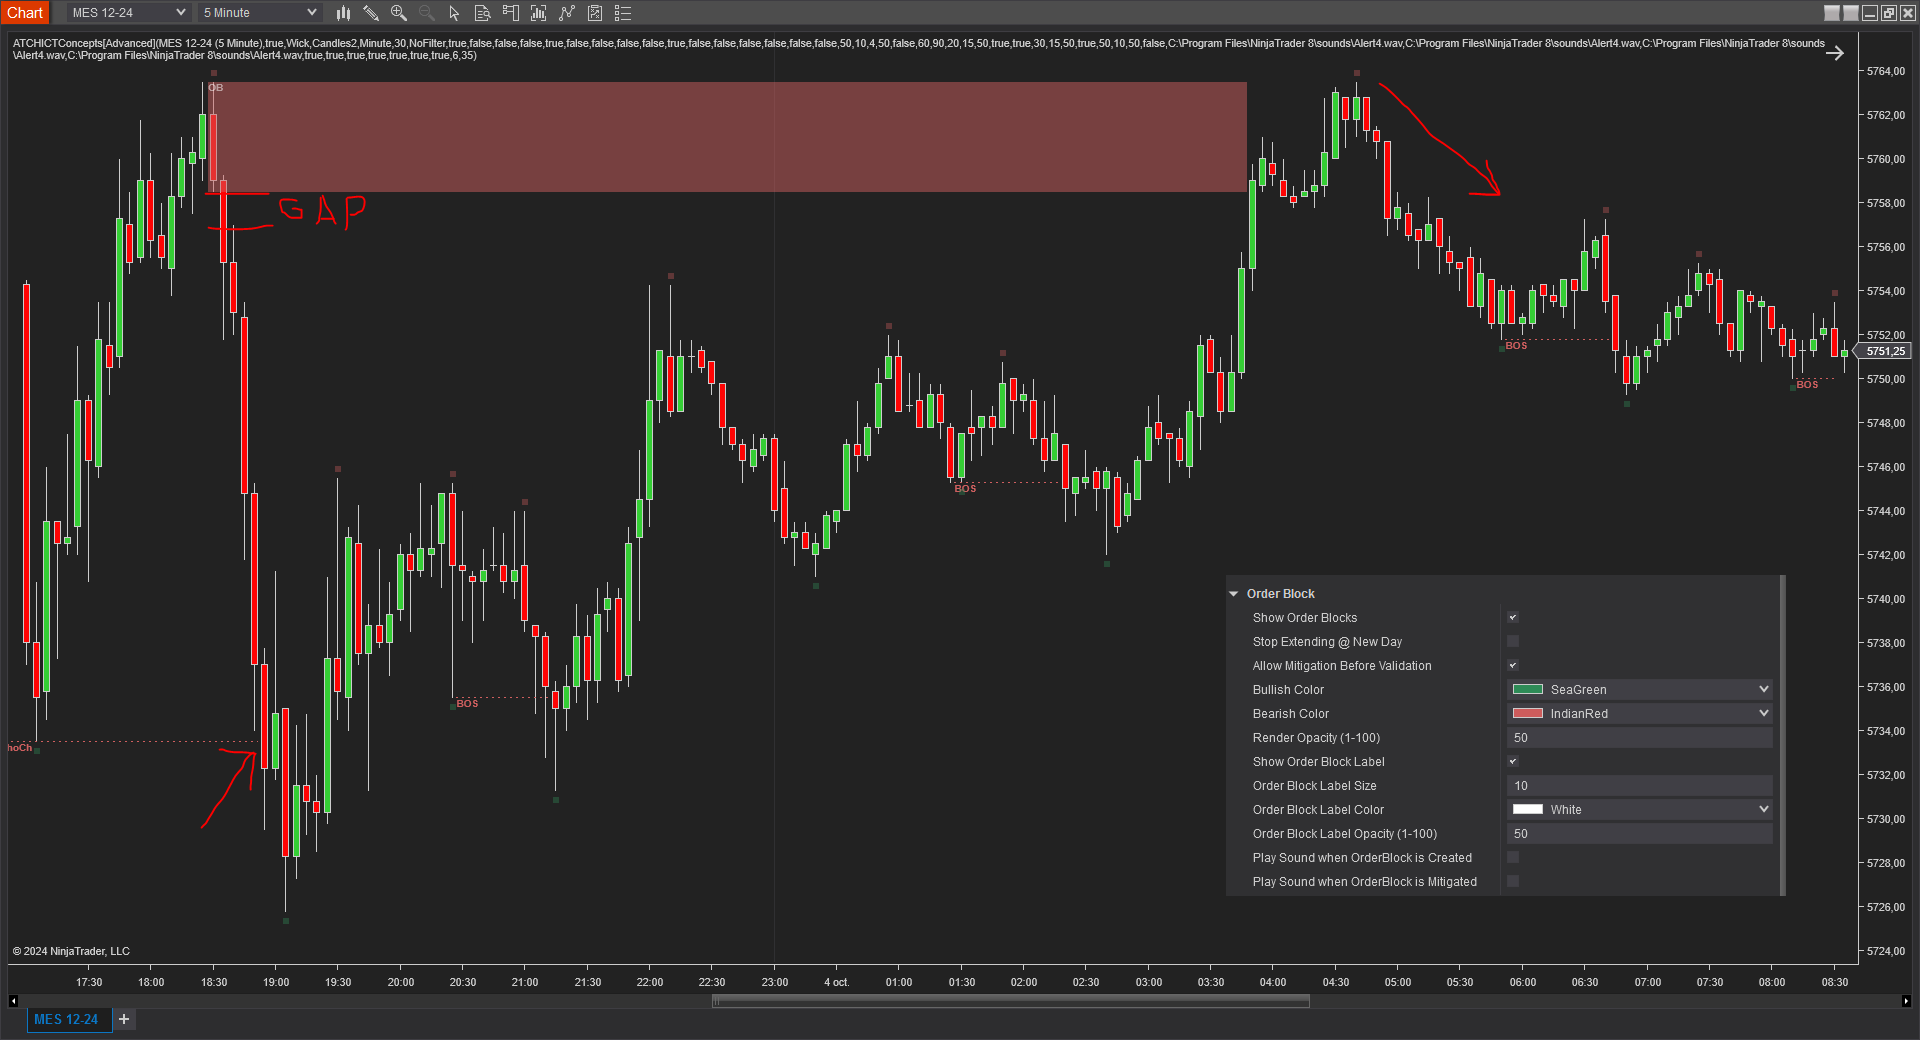
As you can see on the example above, the order bearish block created a FVG right after the candle the defines the Order Block zone. This is the first condition for and order Block to be valid. Then, the order block should not be mitigated by the price until the ChoCh at around 19h00 is created. Order Blocks are traded when the price revisits them, on that example one could enter a short trade when the price mitigated the order block zone and went back down
On this example you can also see a trade setup when the price mitigates the bullish order block, setting the stoploss on the lower level of the orderblock and targeting 1:1 win loss ratio
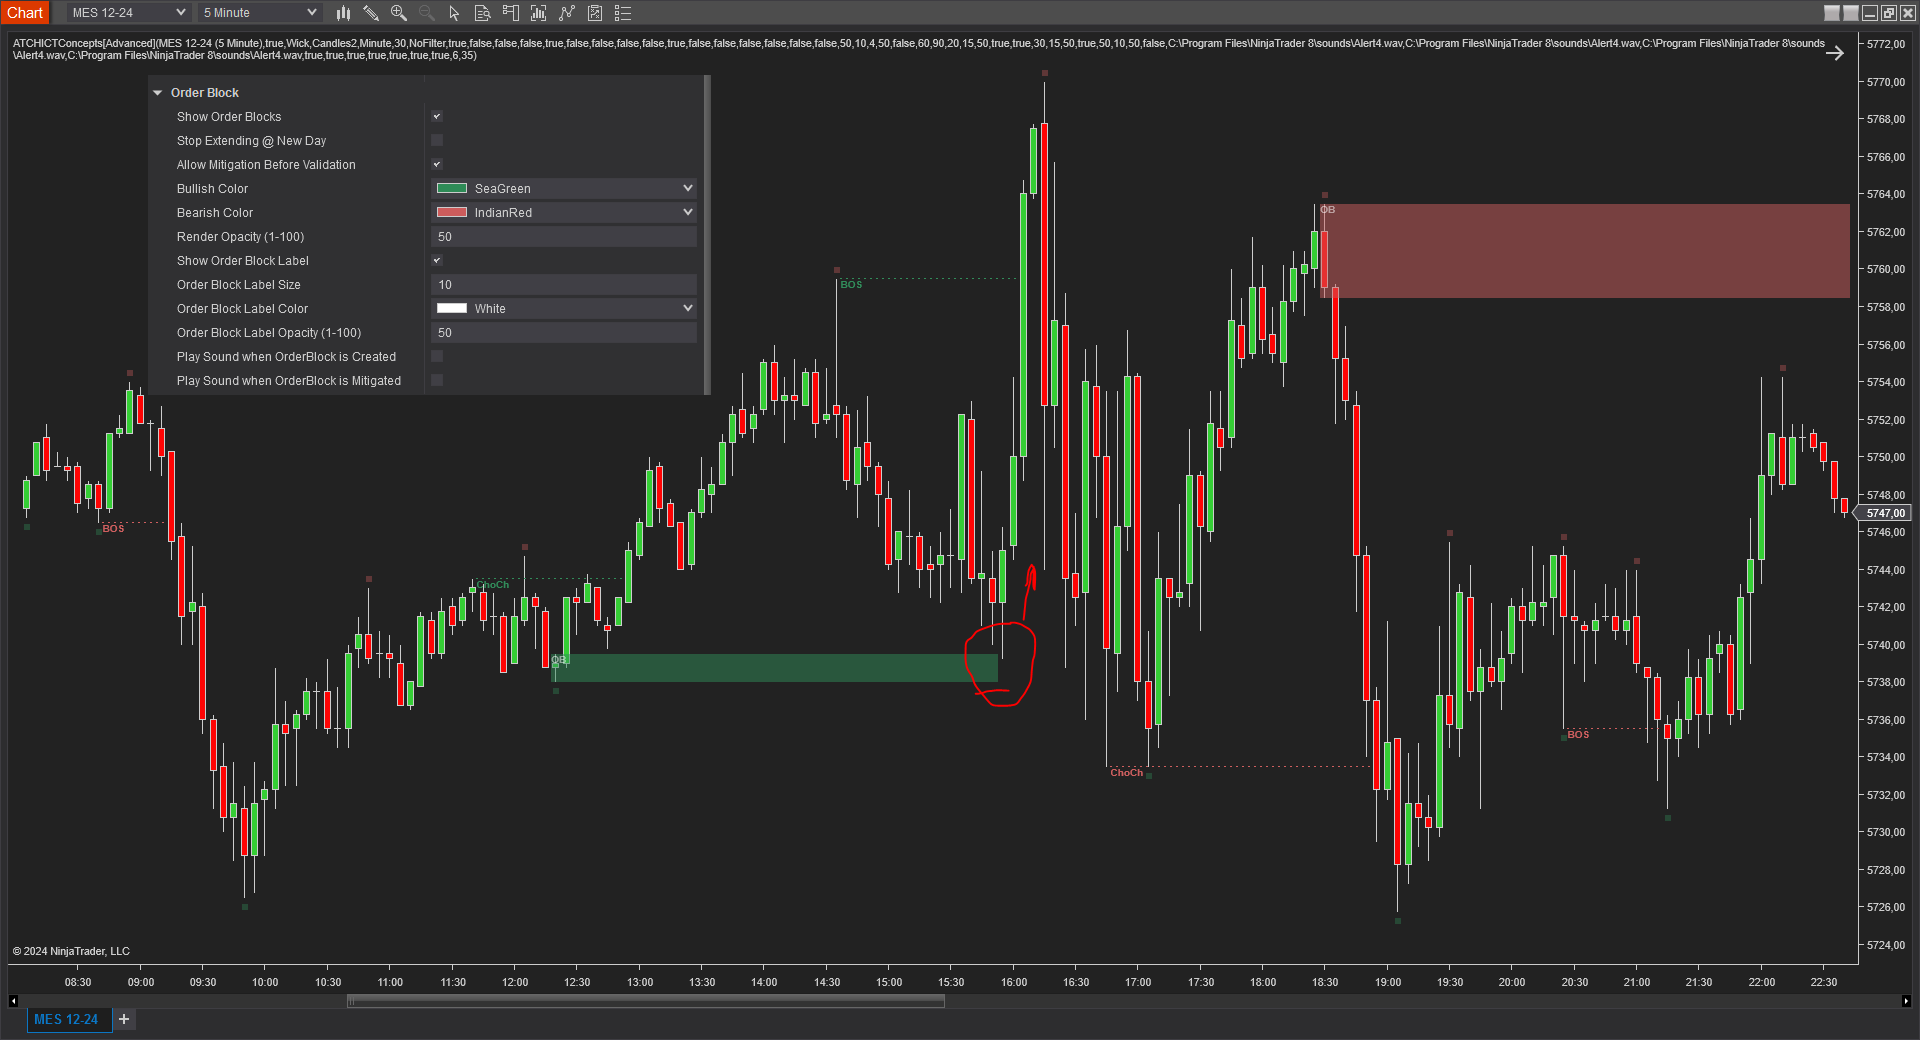
Immediate Rebalances
Immediate rebalances, a concept taught by ICT, hold significant importance in decision-making. To comprehend the concept of immediate rebalance, it's essential to grasp the notion of the fair value gap. A fair value gap arises from market inefficiencies or imbalances, whereas an immediate rebalance leaves no gap, no inefficiencies, or no imbalances that the price would need to return to.
An immediate Rebalance can be successful when the price mark a continuation in the drection of the IR. And it can be a failed IR when the price immediately reverses and goes back into the opposite direction of the IR.
Both successful and failing IR can hold significance in trading when analyzed within the context with other ICT items
On the example above we have the chart on 5 minutes on the MES. Running the indicator on a higher timeframe 15 Minutes. You can see the higher timeframe candles been overlayed which is a cool useful feature. Then we can see the first IR marked as "Fail" with red. The IR is marked fail because the price immediately pulleback lower and broke the IR level, this can mark a strong reversal. This can be a bearish bias and one can look further to ICT triggers to go short
The second example on the right, shows an IR that hold the price above it for multiple swing points and ultimately the price went higher which consists a bullish bias.
NDOG (New Day Opening Gap)
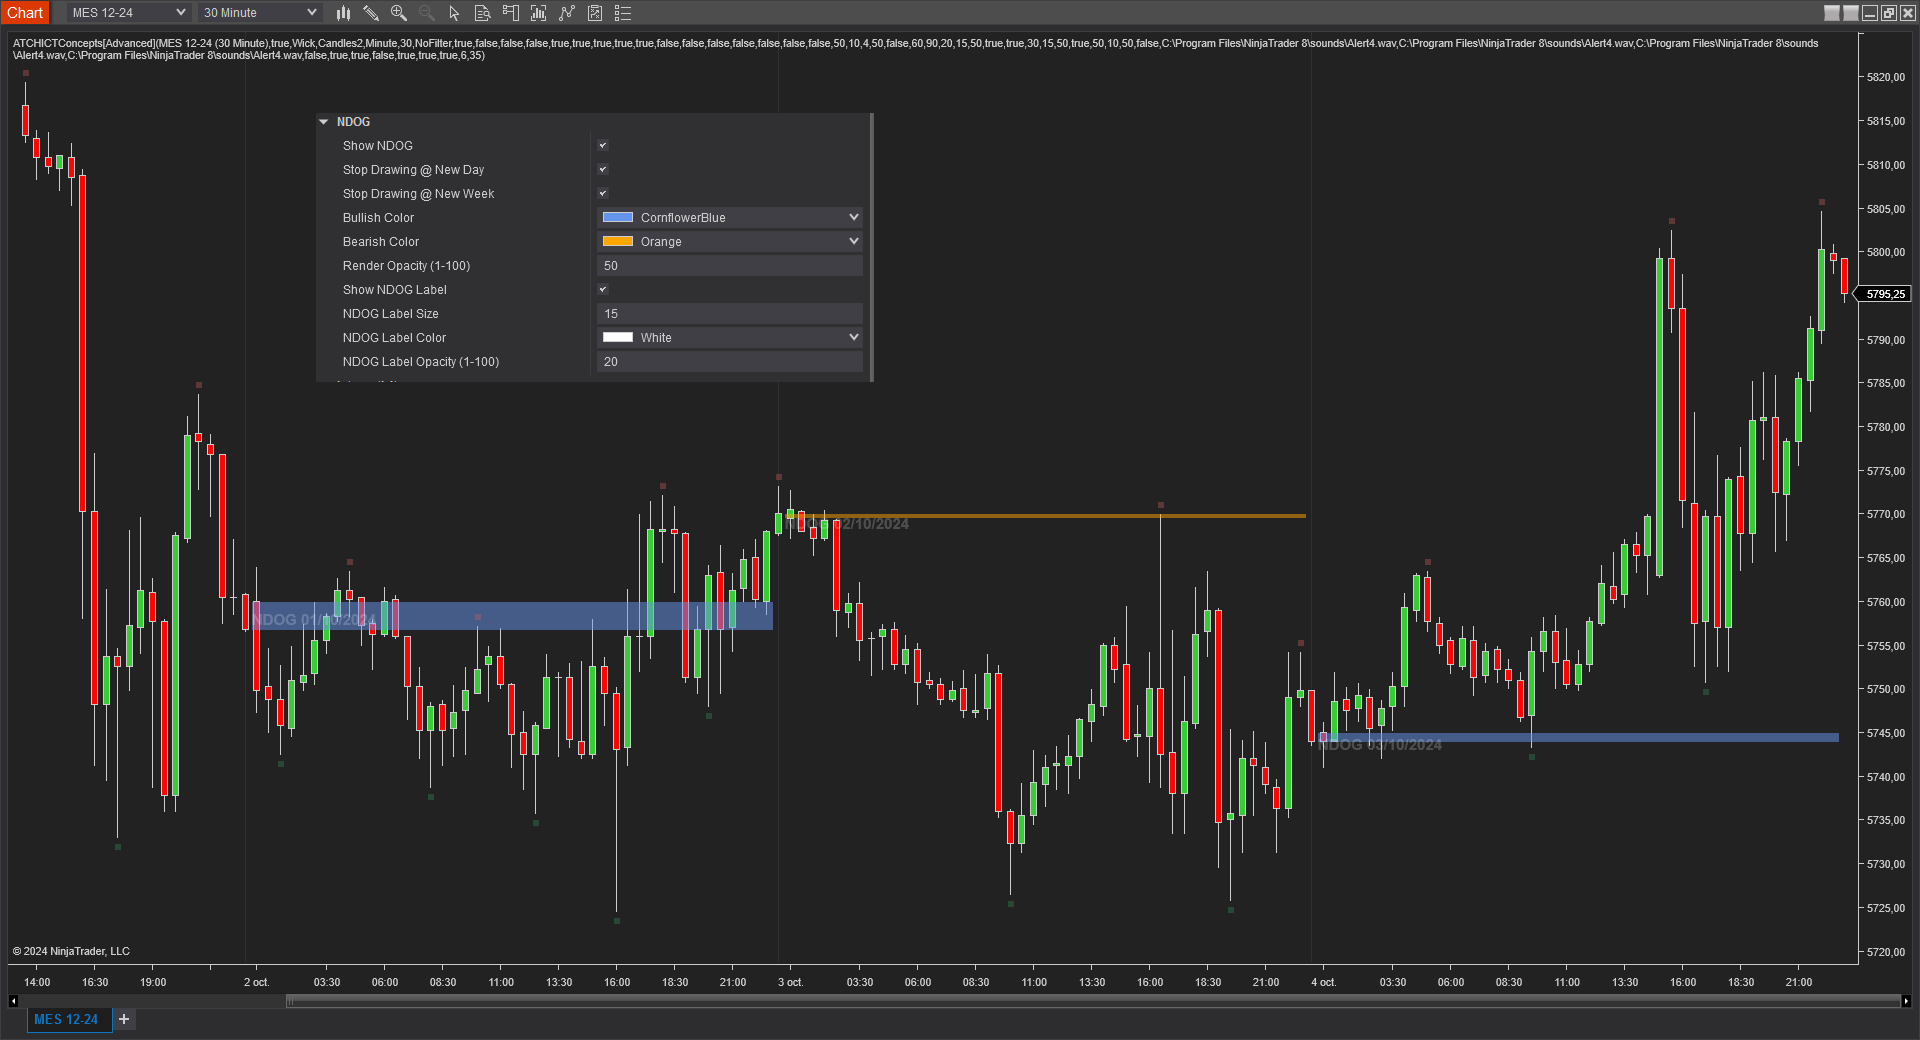
The New Day Opening Gap (NDOG) is defined by (ICT) as the separation in time/price that is caused by the 1-hour break that occurs each day in the futures market. The opening price of the gap is the very first tick that occurs at the 6:00pm [UTC-4] restart. then we look at the 5:00pm closing price of the previous session. These gaps can be draws on liquidity as well as general reference points to determine daily bias
RTH Gap (Opening Range Gap)
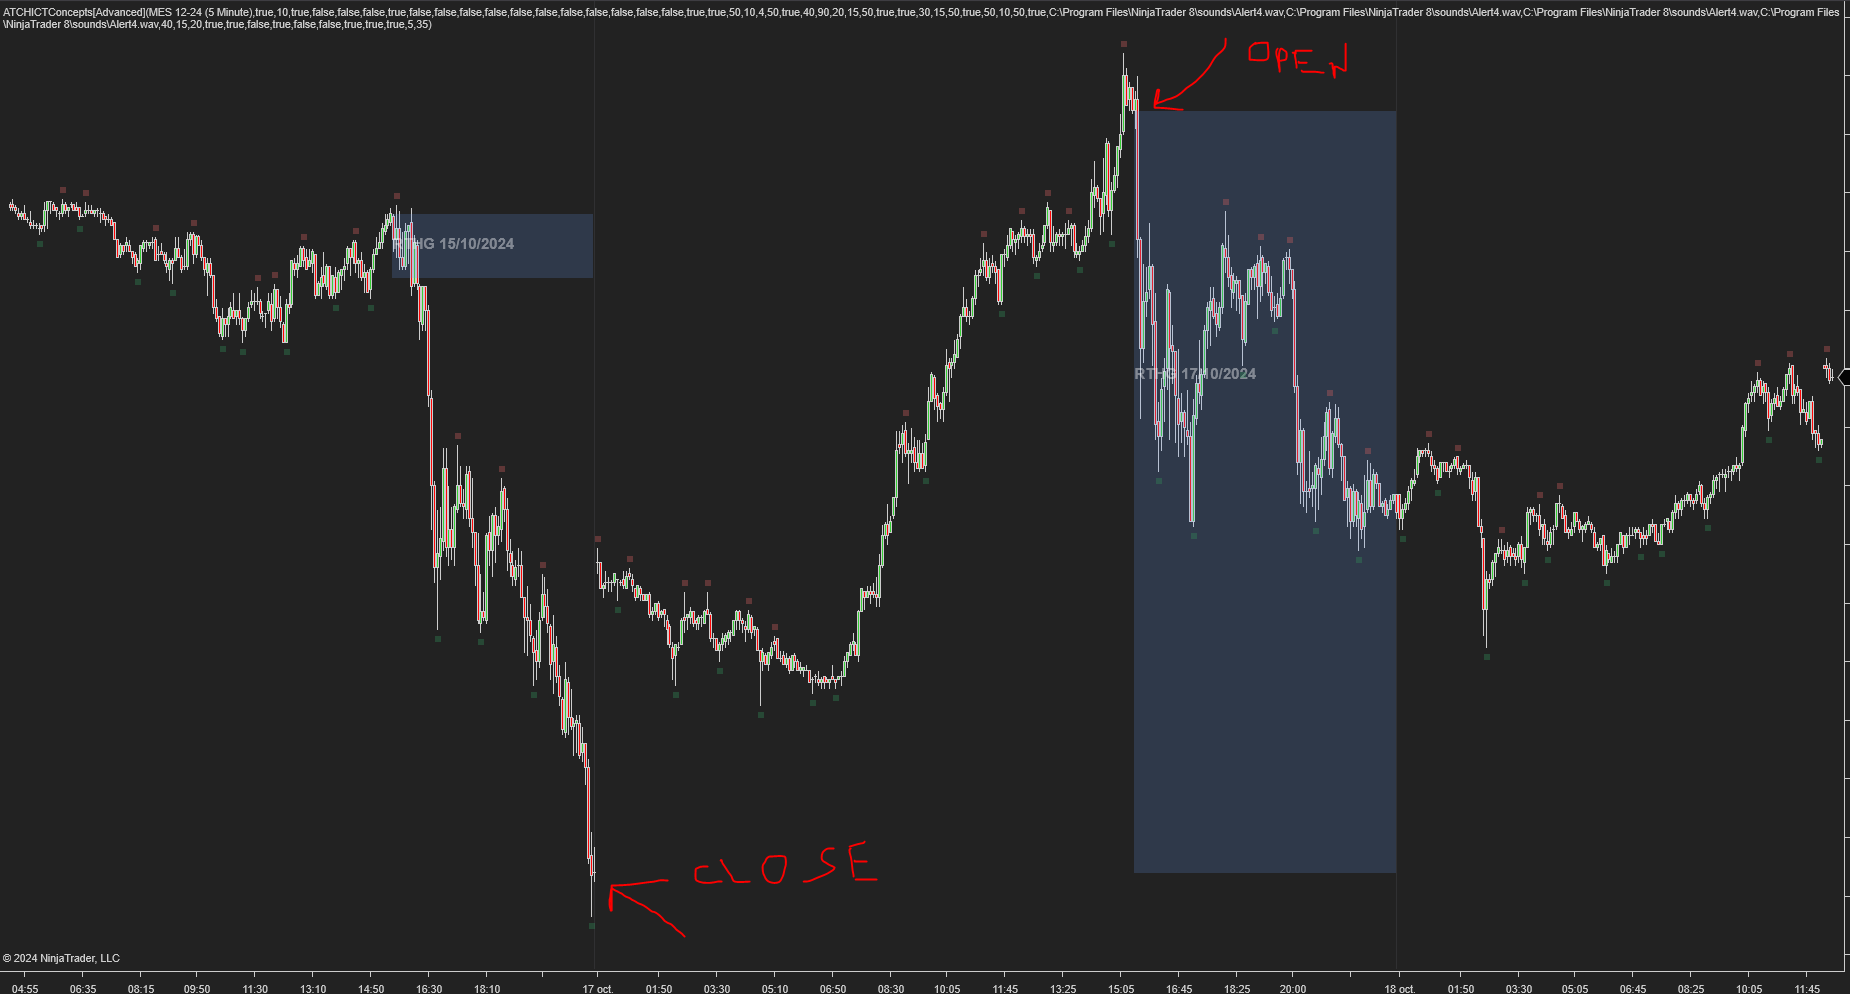
The Opening Range Gap, also known as the Regular Trading Hours (RTH) Gap, is the distance between the first opening tick of a session and the previous session's close, when looking at a chart's Regular Trading Hours (not to be confused with Electronic Trading Hours). This gap is an important element for Futures Market traders that follow the works of The Inner Circle Trader (ICT). To be more specific, the Opening Range Gap occurs between 4:15pm [UTC-4] and 9:30am of the next day.
NWOG (New Week Opening Gap)
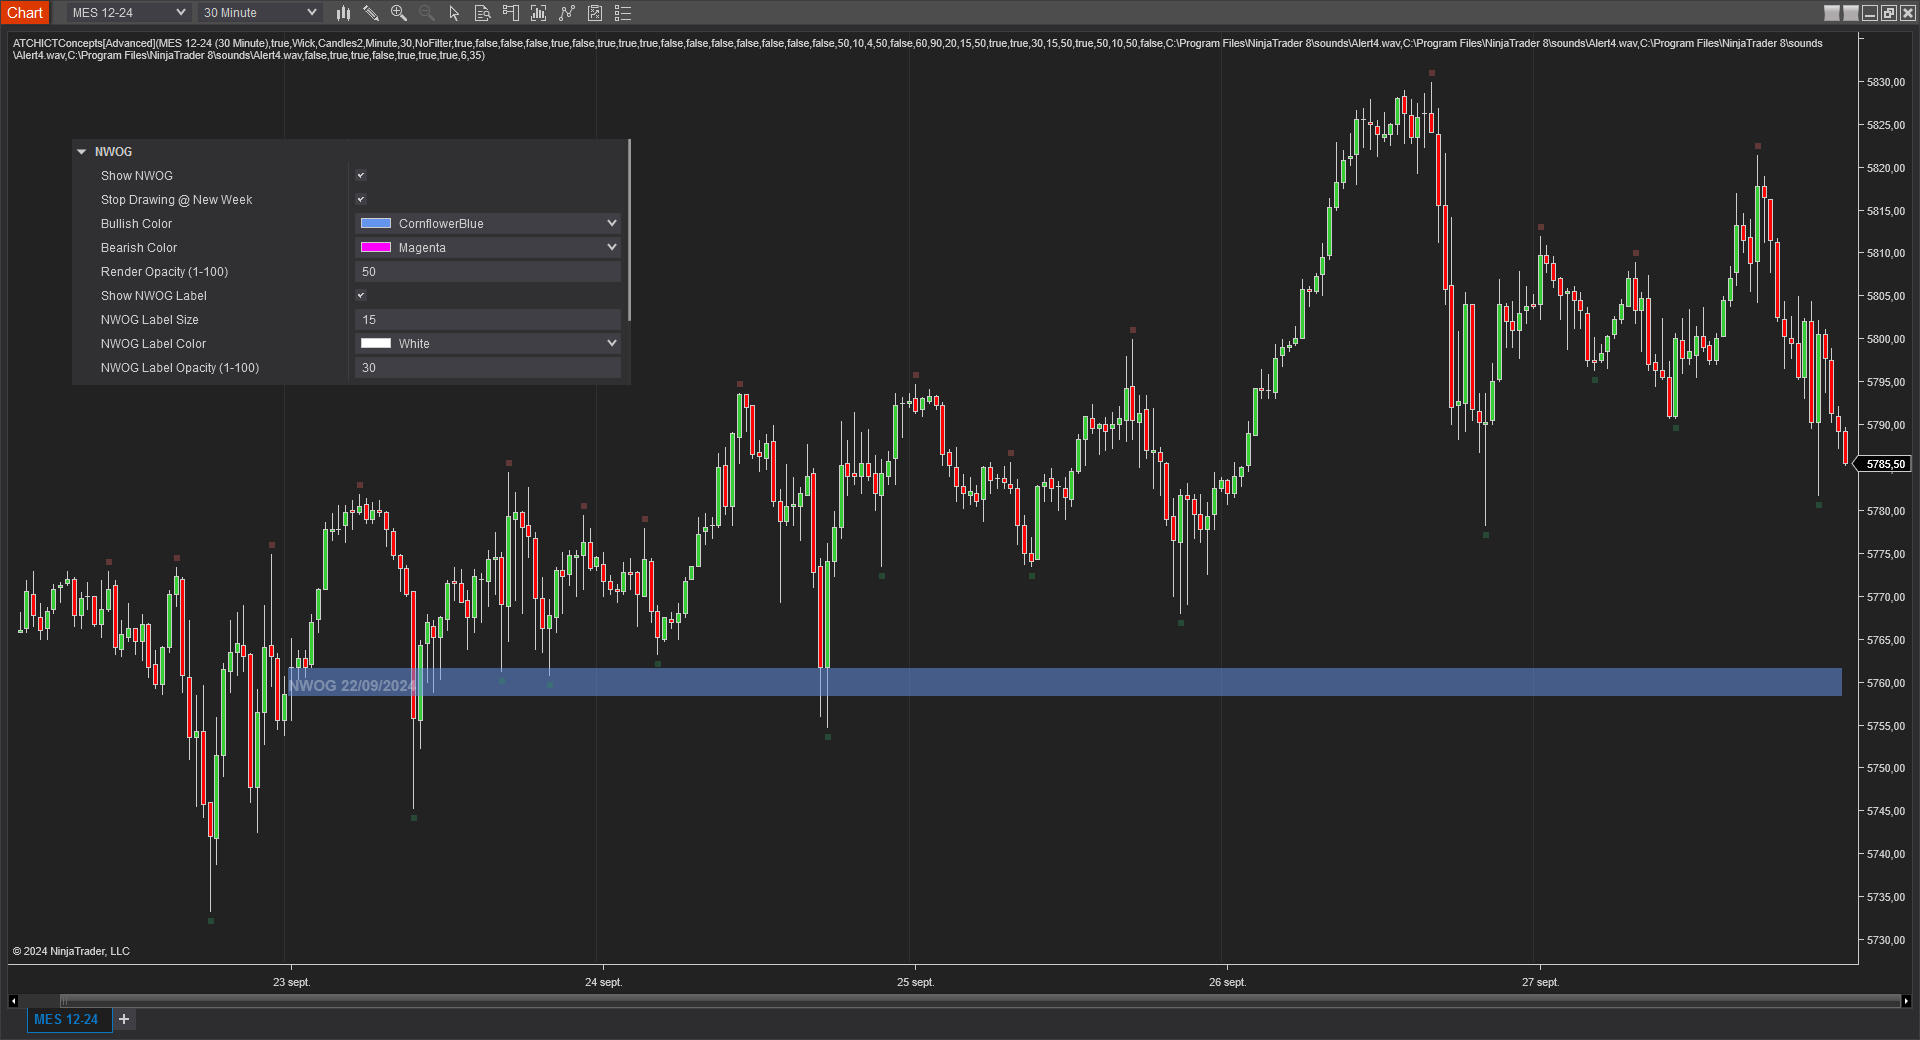
The NWOG is the gap between Friday's closing price and Sunday's opening price. These gaps can be draws on liquidity as well as general reference points to determine weekly bias
Interacte with ICT zones on the Chart
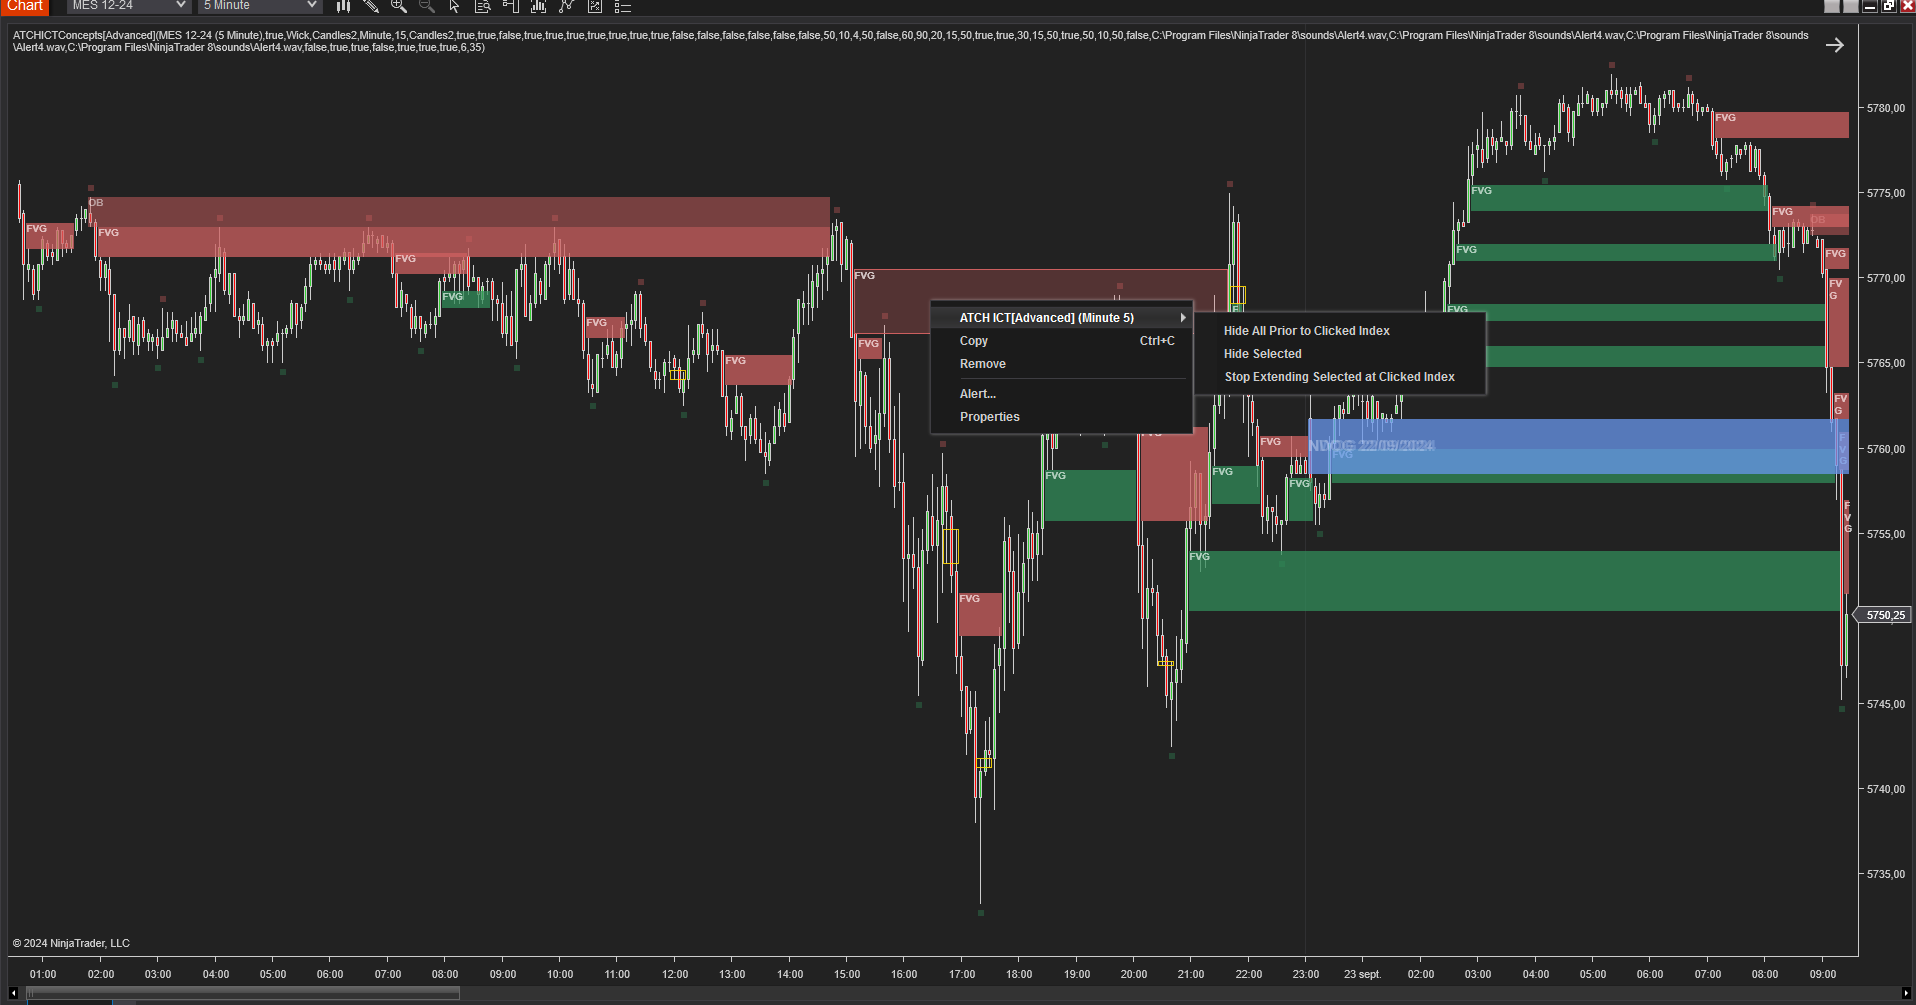
One of the unique features of this indicator compard to other indicators on the market is the interacticity feature. All the ICT zones drawn on the chart can become interactive if you enable the Interactivity parameter. By doing this you can select individual items on the chart, and then right-click to see the context-menu popup with the an entry named ATCH ICT[Advanced] which contains several command buttons:
- The first menu item Hide All prior to clicked Index will hide all the ICT zones prior to where the user clicked on the chart. This is useful if you want to unclutter the chart from past events that are no more pertinent
- The second menu item Hide Selected will hide the selected zone
- The third menu item Stop Extending Selected at Clicked Index will stop the selected zone at the clicked bar Index
- More commands to come in the future upcoming releases....
Features
The ICT Concepts[Advanced] indicator has a set of unique features
- Can be run on a higher timeframe while drawing on a lower timeframe allowing multi-timeframe analysis
- Can overlay drawing of higher timeframe candles when run on Higher Timeframe
- Can play a sound alert on each ICT zone
- Can be run with or without TickReplay on any time-based or price-based Chart
- Interactive commands and operations that can be applied on ICT zones on the chart by right-clicking on the chart
- Active development and constantly adding new features
Parameters
We always try to keep the parameters to minimum.
| License | |
| License | This is the license key you get when you create an account on automated-trading.ch. After creating an account, copy your license key from the billing page. You need to set this parameter only once per month, once the license key is validated it will be remembered for the rest of the month. |
| Market Structure | |
| Swing Period | Swings are higher lows,higher highs, lower highs and lower lows. After each price bar close, a swing can be detected. But just after that, the next bar can cancel the swing at the previous bar by creating a new swing of the same type. Or this can happen on the second bar, or the third, etc... The swing period sets how many bars is enough to seperate two swings of the same type. The more you increase this parameter, the more you decrease the number of swings overall. The more you decrease this parameter, the more you increase the number of overall swings. I personally use the value of 3 or 4 for this parameter. |
| Show Price Swings | This parameter will enable/disable drawing a mark below/above swing price points. This is useful if you want to see how market structure is analyzed since those swing points are the building blocks of the indicator algorithme. |
| Swing Bullish Color | This sets the color brush of the low swing points |
| Swing Bearish Color | This sets the color brush of the high swing points |
| Swing Opacity (1-100) | This sets the opacity of the swing points drawing. The value of 0 is trasparent, and the value of 100 is full opaque |
| Run On Higher TimeFrame | This parameter will enable/disable running the ICT analysis algorithms on a higher timeframe and display the ICT zones on the active chart |
| Higher TimeFrame | This parameter allows to select the higher timeframe if the previous Run On Higher TimeFrame parameter is enabled Make sure to select a higher time-frame in regard of the active charts' timeframe. For example, if the current time-frame on the chart is 15 Minutes, make sure that the value of this parameter represents a bigger time-frame such as 1 Hour. If in that case you select 1 Minute as a higher time-frame for example, the indicator will not work. |
| Higher TimeFrame Period | This parameter sets the period of the higher timeframe if Run On Higher TimeFrame is enabled |
| Draw Higher Timeframe Candles | This parameter will enable drawing (overlaying) higher timeframe candles on top of the active chart |
| Show ChoCh (MSS) | This will enable/disable drawing of Change of Characters or also known as Market Structure Shifts |
| MSS Bullish Color | The color brush of bullish MSS |
| MSS Bearish Color | The color brush of bearish MSS |
| MSS LineStyle | Line Style to draw MSS line |
| Show Choch (MSS) Label | this parameter enables showing a label text on each MSS on the chart |
| Show Break of Structure | This will enable/disable drawing of Break of Strucutres |
| BOS bullish Color | The color brush of bullish Break of Structure drawings on the chart |
| BOS bearish Color | The color brush of bearish Break of Structure drawings on the chart |
| BOS LineStyle | Line style to draw BOS line |
| Show BOS Label | This parameter enables showing a label text on each Break of Structure on the chart |
| Play Sound on MSS or BOS | This parameter will enable playing and alert sound when a market structure event (MSS or BOS) occurs |
| Play Sound File | This parameter will set the file name to be played on sound alert if enabled. This can be set to any .wav file on your computer |
| HTF Candles | |
| This section is visible only when the Run on Higher Timeframe parameter is enabled | |
| Bullish Color | Sets the color brush to draw bullish Higher timeframe candles |
| Bearish Color | Sets the color brush to draw bearish Higher timeframe candles |
| Render Opacity (1-100) | Sets opacity used to draw higher timeframe candles |
| Fair Value Gap | |
| Show Fair Value Gaps | This will enable/disable drawing of Fair Value Gaps |
| FVG Candle Filter | This parameter sets a filter for the FVG detection :
|
| Min. Gap (ticks) | This parameter sets the minimum distance in ticks between the wicks of the Fair Value Gap to be valid. The more you increase this value, the fewer FVGs will be detected. Inversly, the more you decrease this value, the more it increases the number of detected FVGs |
| Mitigation Method |
When price hits the FVG after its formation, it is said to be "mitigated" and it stops from further extending. This parameter allows to chose which
mitigation method is used to set whether an FVG is considered mitigated by the price:
|
| Stop Showing Mitigated | This parameter will hide FVG drawing once they are mitigiated allowing for a more clean chart |
| Stop Extending @ New Day | This parameter will make the FVG zone drawing stop from extending into a new day. You can also achieve this by clicking on individual FVG zones and chose to stop extending them at any given Bar index |
| Show 50% Level | This parameter will draw consequent encroachment (50%) on the FVG zone |
| Shrink FVG | This parameter will shrink the drawing of FVGs each time it is touched by the wick of a candle |
| Bullish Color | The Brush color to draw bullish FVGs |
| Bearish Color | The Brush color to draw bearish FVGs |
| Render Opacity (1-100) | The Brush opacity to draw FVGs |
| Show FVG Label | Enable/disable showing the label on each FVG |
| This section is visible only when the Show FVG Label parameter is enabled | |
| FVG Label Size | FVG label Text Size to be drawn |
| FVG Label Color | FVG label Color |
| FVG Label Opacity (1-100) | FVG label Opacity |
| Play Sound when FVG is created | This parameter will enable playing and alert sound when an FVG is created |
| Play Sound when FVG is mitigated | This parameter will enable playing and alert sound when an FVG is mitigated. Useful if you want to trade FVG pullbacks |
| Play Sound File | This parameter will set the file name to be played on sound alert if enabled. This can be set to any .wav file on your computer |
| Volume Imbalance (VIB) | |
| Show Volume Imbalance | This will enable/disable drawing of Volume Imbalance zones |
| VIB Candle Filter | This parameter sets a filter for the Volume Imbalance detection :
|
| Min. Gap (ticks) | This parameter sets the minimum distance in ticks between the bodies of the Volume Imbalance to be valid. The more you increase this value, the fewer VIBs will be detected. Inversly, the more you decrease this value, the more it increases the number of detected VIBs |
| Mitigation Method |
When price hits the VIB after its formation, it is said to be "mitigated" and it stops from further extending. This parameter allows to chose which
mitigation method is used to set whether a VIB is considered mitigated by the price:
|
| Stop Showing Mitigated | This parameter will hide VIB drawing once they are mitigiated allowing for a more clean chart |
| Stop Extending @ New Day | This parameter will make the VIB zone drawing stop from extending into a new day. You can also achieve this by clicking on individual VIB zones and chose to stop extending them at any given Bar index |
| Show 50% Level | This parameter will draw consequent encroachment (50%) on the VIB zone |
| Bullish Color | The Brush color to draw bullish VIBs |
| Bearish Color | The Brush color to draw bearish VIBs |
| Render Opacity (1-100) | The Brush opacity to draw VIBs |
| Show VIB Label | Enable/disable showing the label on each VIB |
| This section is visible only when the Show VIB Label parameter is enabled | |
| VIB Label Size | VIB label Text Size to be drawn |
| VIB Label Color | VIB label Color |
| VIB Label Opacity (1-100) | VIB label Opacity |
| Play Sound when VIB is created | This parameter will enable playing and alert sound when a VIB is created |
| Play Sound when VIB is mitigated | This parameter will enable playing and alert sound when a VIB is mitigated. Useful if you want to trade VIB pullbacks |
| Play Sound File | This parameter will set the file name to be played on sound alert if enabled. This can be set to any .wav file on your computer |
| Gap Imbalance (GIB) | |
| Show Gap Imbalance | This will enable/disable drawing of Gap Imbalance zones |
| GIB Candle Filter | This parameter sets a filter for the Gap Imbalance detection :
|
| Min. Gap (ticks) | This parameter sets the minimum distance in ticks between the bodies of the Gap Imbalance to be valid. The more you increase this value, the fewer GIBs will be detected. Inversly, the more you decrease this value, the more it increases the number of detected GIBs |
| Mitigation Method |
When price hits the GIB after its formation, it is said to be "mitigated" and it stops from further extending. This parameter allows to chose which
mitigation method is used to set whether a GIB is considered mitigated by the price:
|
| Stop Showing Mitigated | This parameter will hide GIB drawing once they are mitigiated allowing for a more clean chart |
| Stop Extending @ New Day | This parameter will make the GIB zone drawing stop from extending into a new day. You can also achieve this by clicking on individual GIB zones and chose to stop extending them at any given Bar index |
| Show 50% Level | This parameter will draw consequent encroachment (50%) on the GIB zone |
| Bullish Color | The Brush color to draw bullish GIBs |
| Bearish Color | The Brush color to draw bearish GIBs |
| Render Opacity (1-100) | The Brush opacity to draw GIBs |
| Show GIB Label | Enable/disable showing the label on each GIB |
| This section is visible only when the Show GIB Label parameter is enabled | |
| GIB Label Size | GIB label Text Size to be drawn |
| GIB Label Color | GIB label Color |
| GIB Label Opacity (1-100) | GIB label Opacity |
| Play Sound when GIB is created | This parameter will enable playing and alert sound when a GIB is created |
| Play Sound when GIB is mitigated | This parameter will enable playing and alert sound when a GIB is mitigated. Useful if you want to trade GIB pullbacks |
| Play Sound File | This parameter will set the file name to be played on sound alert if enabled. This can be set to any .wav file on your computer |
| Immediate Rebalance | |
| Show Immediate Rebalance | Enable/disable display of Immediate rebalance |
| This following section is visible only when the Show Immediate Rebalance parameter is enabled | |
| Candle Filter | This parameter sets a filter for the Immediate Rebalance detection :
|
| Bullish Color | Sets the color brush to draw bullish Immediate Rebalance |
| Bearish Color | Sets the color brush to draw bearish Immediate Rebalance |
| Render Opacity (1-100) | Sets opacity used to draw Immediate Rebalance |
| Play Sound on Immediate Rebalance | This parameter will enable playing and alert sound when an IR is created |
| Play Sound File | This parameter will set the file name to be played on sound alert if enabled. This can be set to any .wav file on your computer |
| Order Block | |
| Show Order Blocks | Enable/disable display of Order Blocks |
| This following section is visible only when the Show Order Blocks parameter is enabled | |
| Stop Extending @ New Day | This parameter will make the Order Block zones drawing stop from extending into a new day. You can also achieve this by clicking on individual Order Block zones and chose to stop extending them at any given Bar index |
| Allow Mitigation Before Validation | An order block is valid when a specific set of rules are verified. One of those rules is that the price should not mitigate the order block zone. This parameter will enable giving this rule an exception and allow OrderBlock to be valid even though they are mitigated by the price prior to their creation. |
| Confirmation Mode | This parameter sets the mode that confirms formation of the Order Block|
| Bullish Color | Sets the color brush to draw bullish Order Blocks |
| Bearish Color | Sets the color brush to draw bearish Order Blocks |
| Render Opacity (1-100) | Sets opacity used to draw Order Blocks |
| Show Order Block Label | Enable/disable showing the label on each Order Block |
| This section is visible only when the Show Order Block Label parameter is enabled | |
| Order Block Label Size | Order Block label Text Size to be drawn |
| Order Block Label Color | Order Block label Color |
| Order Block Label Opacity (1-100) | Order Block label drawing Opacity from 1 (transparent) to 100 (fully opaque) |
| Play Sound when OrderBlock is created | This parameter will enable playing and alert sound when an OrderBlock is created |
| Play Sound when OrderBlock is mitigated | This parameter will enable playing and alert sound when an OrderBlock is mitigated. Useful if you want to trade OrderBlock pullbacks |
| Play Sound File | This parameter will set the file name to be played on sound alert if enabled. This can be set to any .wav file on your computer |
| NWOG (New Week Opening Gap) | |
| Show NWOG | Enable/disable display of NWOG zones |
| This following section is visible only when the Show NWOG parameter is enabled | |
| Stop Drawing @ New Week | This parameter will make the NWOG zones drawing stop from extending into a new week. You can also achieve this by clicking on individual NWOG zones and chose to stop extending them at any given Bar index |
| Show 50% Level | This parameter will draw consequent encroachment (50%) on the NWOG zone |
| Show 75% Level | This parameter will draw Quadrant 75% level on the NWOG zone |
| Show 25% Level | This parameter will draw Quadrant 25% level on the NWOG zone |
| Bullish Color | Sets the color brush to draw bullish NWOG zones |
| Bearish Color | Sets the color brush to draw bearish NWOG zones |
| Render Opacity (1-100) | Sets opacity used to draw NWOG zones |
| Show NWOG Label | Enable/disable showing the label on each NWOG zones |
| This section is visible only when the Show NWOG Label parameter is enabled | |
| NWOG Label Size | NWOG label Text Size to be drawn |
| NWOG Label Color | NWOG label Color |
| NWOG Label Opacity (1-100) | NWOG label drawing Opacity from 1 (transparent) to 100 (fully opaque) |
| NDOG (New Day Opening Gap) | |
| Show NDOG | Enable/disable display of NDOG zones |
| This following section is visible only when the Show NDOG parameter is enabled | |
| Stop Drawing @ New Day | This parameter will make the NDOG zones drawing stop from extending into a new day. You can also achieve this by clicking on individual NDOG zones and chose to stop extending them at any given Bar index |
| Stop Drawing @ New Week | This parameter will make the NDOG zones drawing stop from extending into a new week. You can also achieve this by clicking on individual NDOG zones and chose to stop extending them at any given Bar index |
| Show 50% Level | This parameter will draw consequent encroachment (50%) on the NDOG zone |
| Show 75% Level | This parameter will draw Quadrant 75% level on the NDOG zone |
| Show 25% Level | This parameter will draw Quadrant 25% level on the NDOG zone |
| Bullish Color | Sets the color brush to draw bullish NDOG zones |
| Bearish Color | Sets the color brush to draw bearish NDOG zones |
| Render Opacity (1-100) | Sets opacity used to draw NDOG zones |
| Show NDOG Label | Enable/disable showing the label on each NDOG zones |
| This section is visible only when the Show NDOG Label parameter is enabled | |
| NDOG Label Size | NDOG label Text Size to be drawn |
| NDOG Label Color | NDOG label Color |
| NDOG Label Opacity (1-100) | NDOG label drawing Opacity from 1 (transparent) to 100 (fully opaque) |
| RTHG (Opening Range Gap) | |
| Show Opening Range Gap | Enable/disable display of RTHG zones |
| This following section is visible only when the Show Opening Range Gap parameter is enabled | |
| Stop Drawing @ New Day | This parameter will make the RTHG zones drawing stop from extending into a new day. You can also achieve this by clicking on individual RTHG zones and chose to stop extending them at any given Bar index |
| Stop Drawing @ New Week | This parameter will make the RTHG zones drawing stop from extending into a new week. You can also achieve this by clicking on individual RTHG zones and chose to stop extending them at any given Bar index |
| Show 50% Level | This parameter will draw consequent encroachment (50%) on the RTHG zone |
| Show 75% Level | This parameter will draw Quadrant 75% level on the RTHG zone |
| Show 25% Level | This parameter will draw Quadrant 25% level on the RTHG zone |
| Bullish Color | Sets the color brush to draw bullish RTHG zones |
| Bearish Color | Sets the color brush to draw bearish RTHG zones |
| Render Opacity (1-100) | Sets opacity used to draw RTHG zones |
| Show RTHG Label | Enable/disable showing the label on each RTHG zones |
| This section is visible only when the Show RTHG Label parameter is enabled | |
| RTHG Label Size | RTHG label Text Size to be drawn |
| RTHG Label Color | RTHG label Color |
| RTHG Label Opacity (1-100) | RTHG label drawing Opacity from 1 (transparent) to 100 (fully opaque) |
| Interactivity | |
| Enable Interactivity | Enable/Disable Interactivity features when Right clicking on ICT items on the chart |
| Hide Selected | When you click on this command button, the clicked zone is hidden. This is useful if you want to hide a specific ICT zone (FVG, OrderBlock, NDOG, NWOG...) |
| Hide All Prior to Clicked Index | When you click on this command button, all the zones on the left of the clicked bar index are hidden. This is useful to unclutter the chart drawings starting from a certain point in time on the chart |
| Stop Extending Selected @ Current Bar | When you click on this command button, the clicked zone will be resized to the clicked bar index and it will stop form further extending. This is useful if, for example, you think that an Order Block zone is not of interest no more and you which to stop it from extending to focus on another ICT zone. Or this can be useful to stop the current day NDOG zone from extending at a certain time of the day to not overlap with other zones |
Download & Installation Instructions
To download and install the indicator follow the instructions below
- Click on the below download button to download the Indicator file
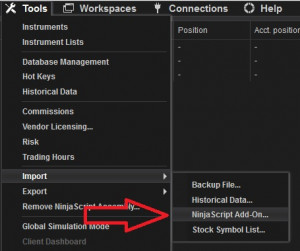
- Import the downloaded .zip file into NinjaTrader using the import NinjaScript menu item
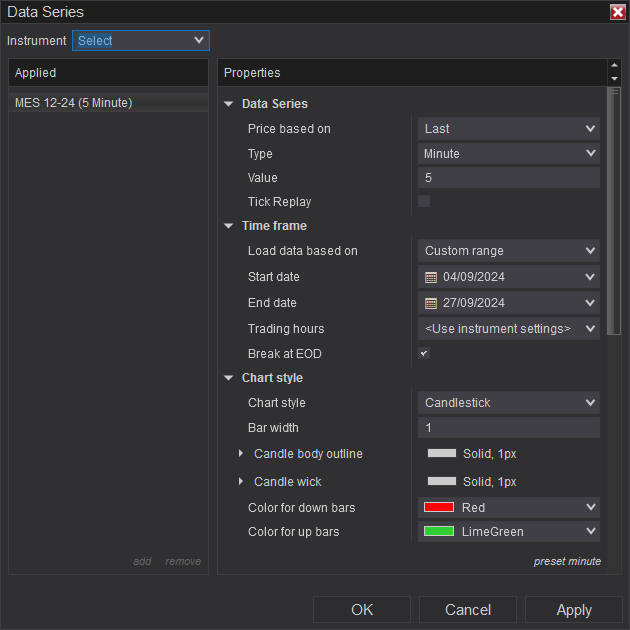
- Next, open a new chart window
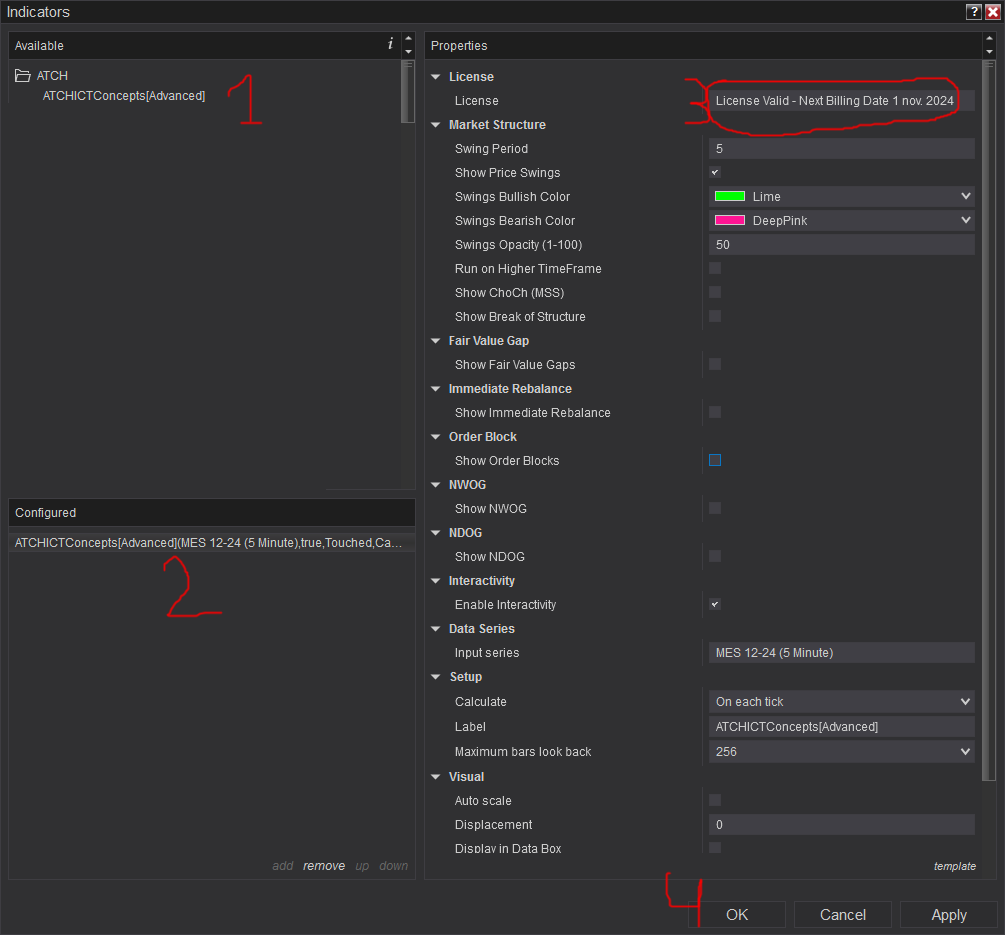
- After installing the indicator and opening a new Chart window you should add the indicator to the chart. Right-click on the chart and click on Indicators...
- Copy/Paste your license key that you can find on the Billing page into the license parameter
- The indicator requires the Premium Subscription. Check the Pricing page for details
- After adding the indicator to the chart with a valid license, the indicator will be run on Historical data loaded on the chart.
- After that, the indicator is added with success and will continue to run on live market data
Frequantly Asked Questions
General
Yes, If you have an idea that you believe can improve this indicator, I will be more then happy to hear from you. Please use the contact page to send me a message
No, the source code of the indicator is protected for copyright reasons
Yes you can use this indicator with or without TickReplay seamlessly. Using the Rick Replay option will make NinjaTrader slower since it will make calculations on each Tick
Subscriptions Q&A
After you Register, you will get access to the Dashboard where you can grab your license and use it on all the free or premium products. We don't use the built-in NinjaTrader Vendor licensing system. We have developed our custom system where you need to submit the license number on each product you are using
Yes, you can Cancel/Resume your subscription with a click of a button with no questions asked. You don't even need to request something or send a message. You can manage your subscription in a completely autonomous way.
Our products will verify the license validity at 1st day of each month. At that date, you need to provide the license number to the product (with a simple copy/paste) so that it will be valid to the rest of the month.
We do not store payment credentials, they are encrypted and passed to Stripe or PayPal for a safe & secure way to purchase subscriptions on our site.
Please send us a message from the Contact Page
Release Notes
- Added Volume Imabalance (VIB)
- Added Gap Imabalance (GIB)
- Fix Bug when checking license
- Fix Bug : indicator hides Grid lines when added to chart
- Fix bug on labelling FVG as "OB"
- Adding Shrinking FVG rendering (requested by users)
- Fix bug on rendering causing indicator stop working
- Added "Stop Showing Mitigated" Fvg parameter
- Added consequent encroachment 50%, 25% and 75% to NDWOG, NWOG, RTGH and FVGs
- Added Confirmation Mode parameter to the OrderBlock section
- Fix: RTH Gap now can be remove interactively
- Added Linestyle for MSS and BOS line drawing
- Removed Log output slowing down peformance
- Added RTH Gap (Opening Range Gap)
- Fix NDOG and NDWOG opacity
- Fix false positive virus detection
- Fix License detection error
- Fix installation error
- First Release of the indicator
User Comments & Feedback
You can find feedback of our users and ask questions about this strategy by joining our discord community by following this invite link or clicking on the Discord logo image. Joining is completely free
![]()