Index
Prequisites
To use this indicator you should have available the following prequisites
- NinjaTrader 8. Click here to download
- automated-trading.ch Account with Premium Subscription
Description
The XABCD Harmonics indicator is a premium Harmonic patterns auto-recognition indicator. Harmonic patterns profit from the natural order of the financial markets.
The harmonic methodology utilizes the recognition of specific price patterns and the alignment of Fibonacci ratios to determine highly probable reversal points in the financial markets. This methodology assumes that trading patterns or cycles, like many patterns and cycles in life, repeat themselves. The key is to identify these patterns, and to enter or to exit a position based upon a high degree of probability that the same historic price action will occur. Although these patterns are not 100% accurate, these situations have been historically proven. If these set-ups are identified correctly, it is possible to identify significant opportunities with a very limited risk.
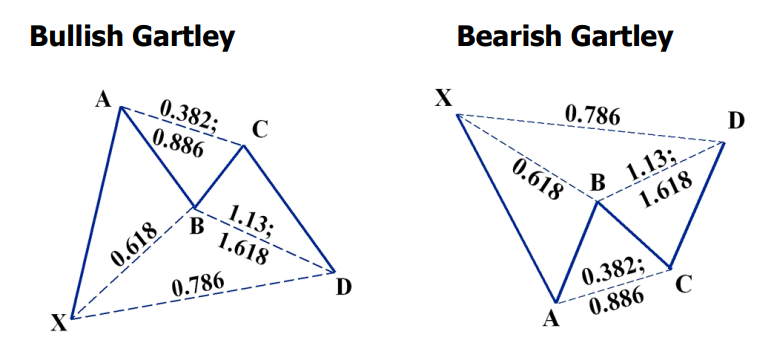
Harmonics are 5 points patterns that are frequently referred to as XABCD patterns. These are the most known harmonic patterns:
| Gartley |
|
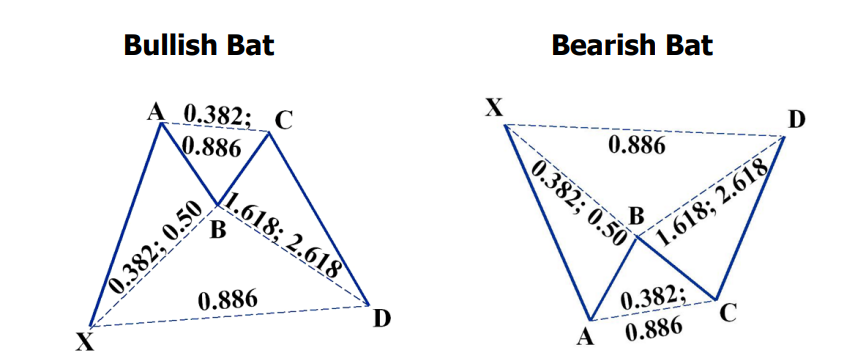
| Bat |
|
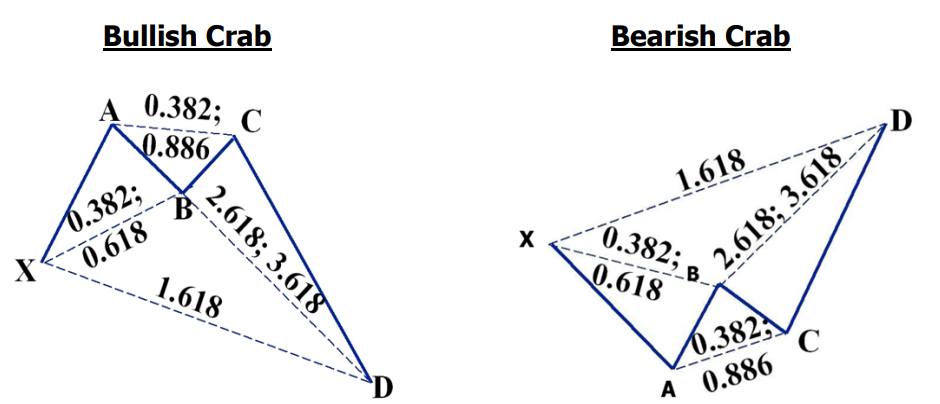
| Crab |
|
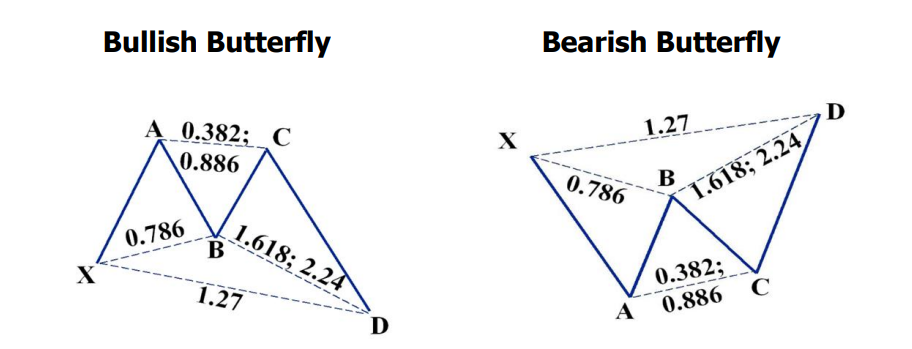
| Butterfly |
|
| Shark |
|
| Cypher |
|
Those patterns are defined by swing points generally named X,A,B,C and D. These points define Legs on which we can calulate ratios.
For example the AB/XA ratio is calculated by dividing the AB leg retracement by the XA price initial move. When all of the legs respect a specific ratio rule set, those patterns are recognized.
Examples
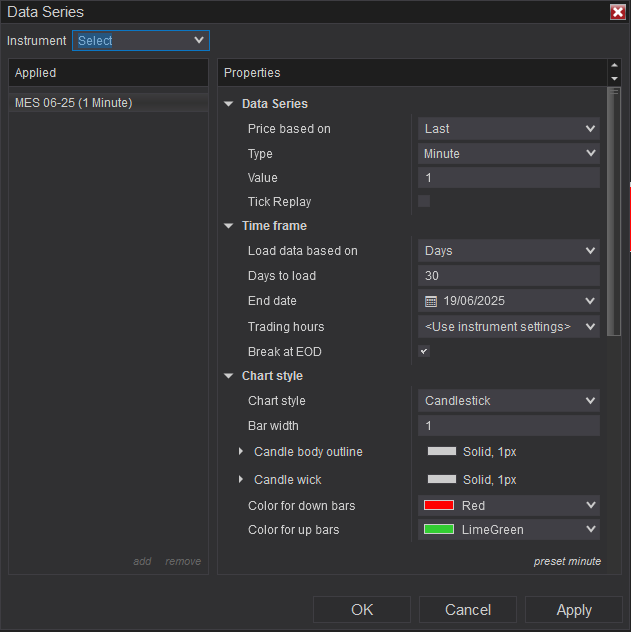
These examples were handpicked to show the best case scenarios where the indicator detects valid patterns. In the cas of real-time trading, the patterns detected will not always lead to a winning trade and you will need to make decisions on wether to enter or skip a trade. These examples are all taken on the MES instrument on the 1 Minute timeframe
Here are few examples of the indicator in action:
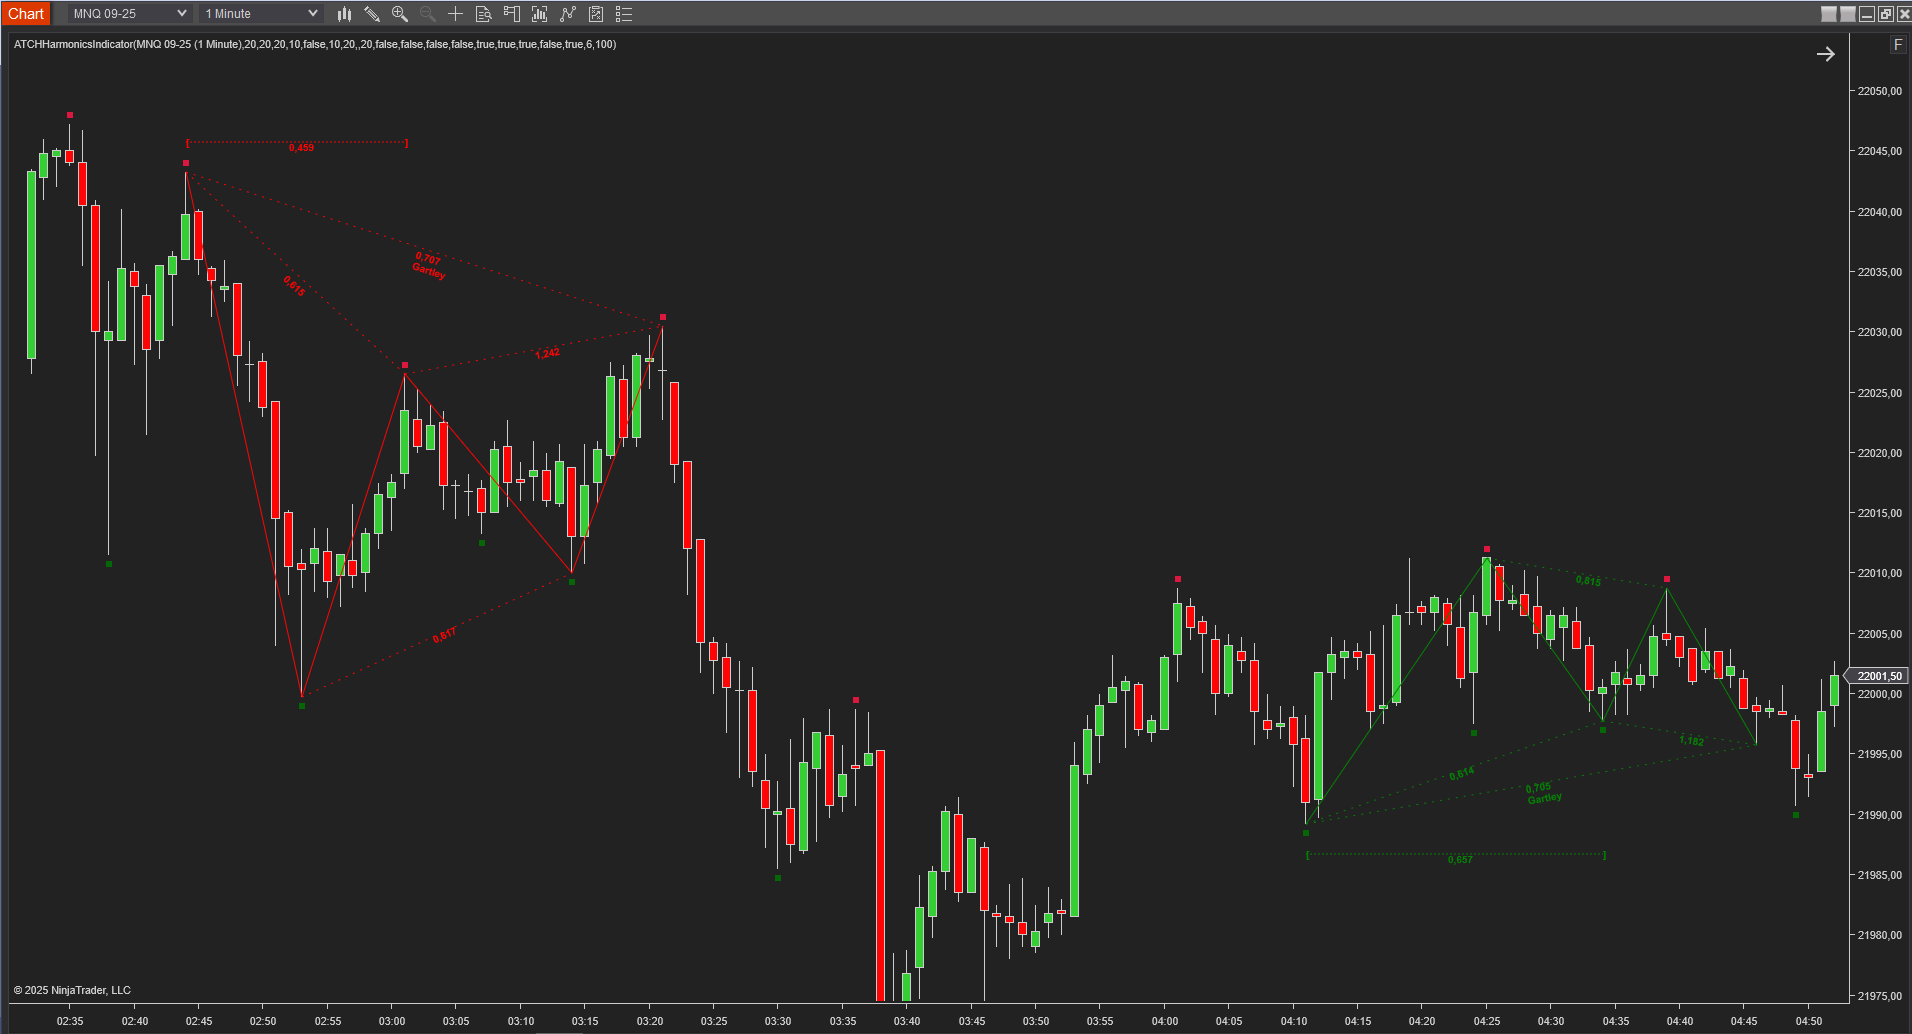
The Gartley pattern is shown in this example. The indicator allows to set a ratio tolerance in percentage to these ratios which allows to tune up and down the sensitivity of detection of those ratios. A higher tolerance value will allow of a higher number of detected patterns. A lower ratio tolerance will result in fewer patterns detected.
You can also notice the horizontal ratio drawn spanning the XB leg or on the BD leg. This ratio is the Time ratio that calculates the time ratio of the two halves of the pattern. The first half is from the start point until the mid point which is point X. And the second half is between point B and the last point which is point D. The ideal value of this ratio is 0.5 (50%) which means the pattern is perfectly symmetrical. On the above example you can the value is 0.459 on the first pattern
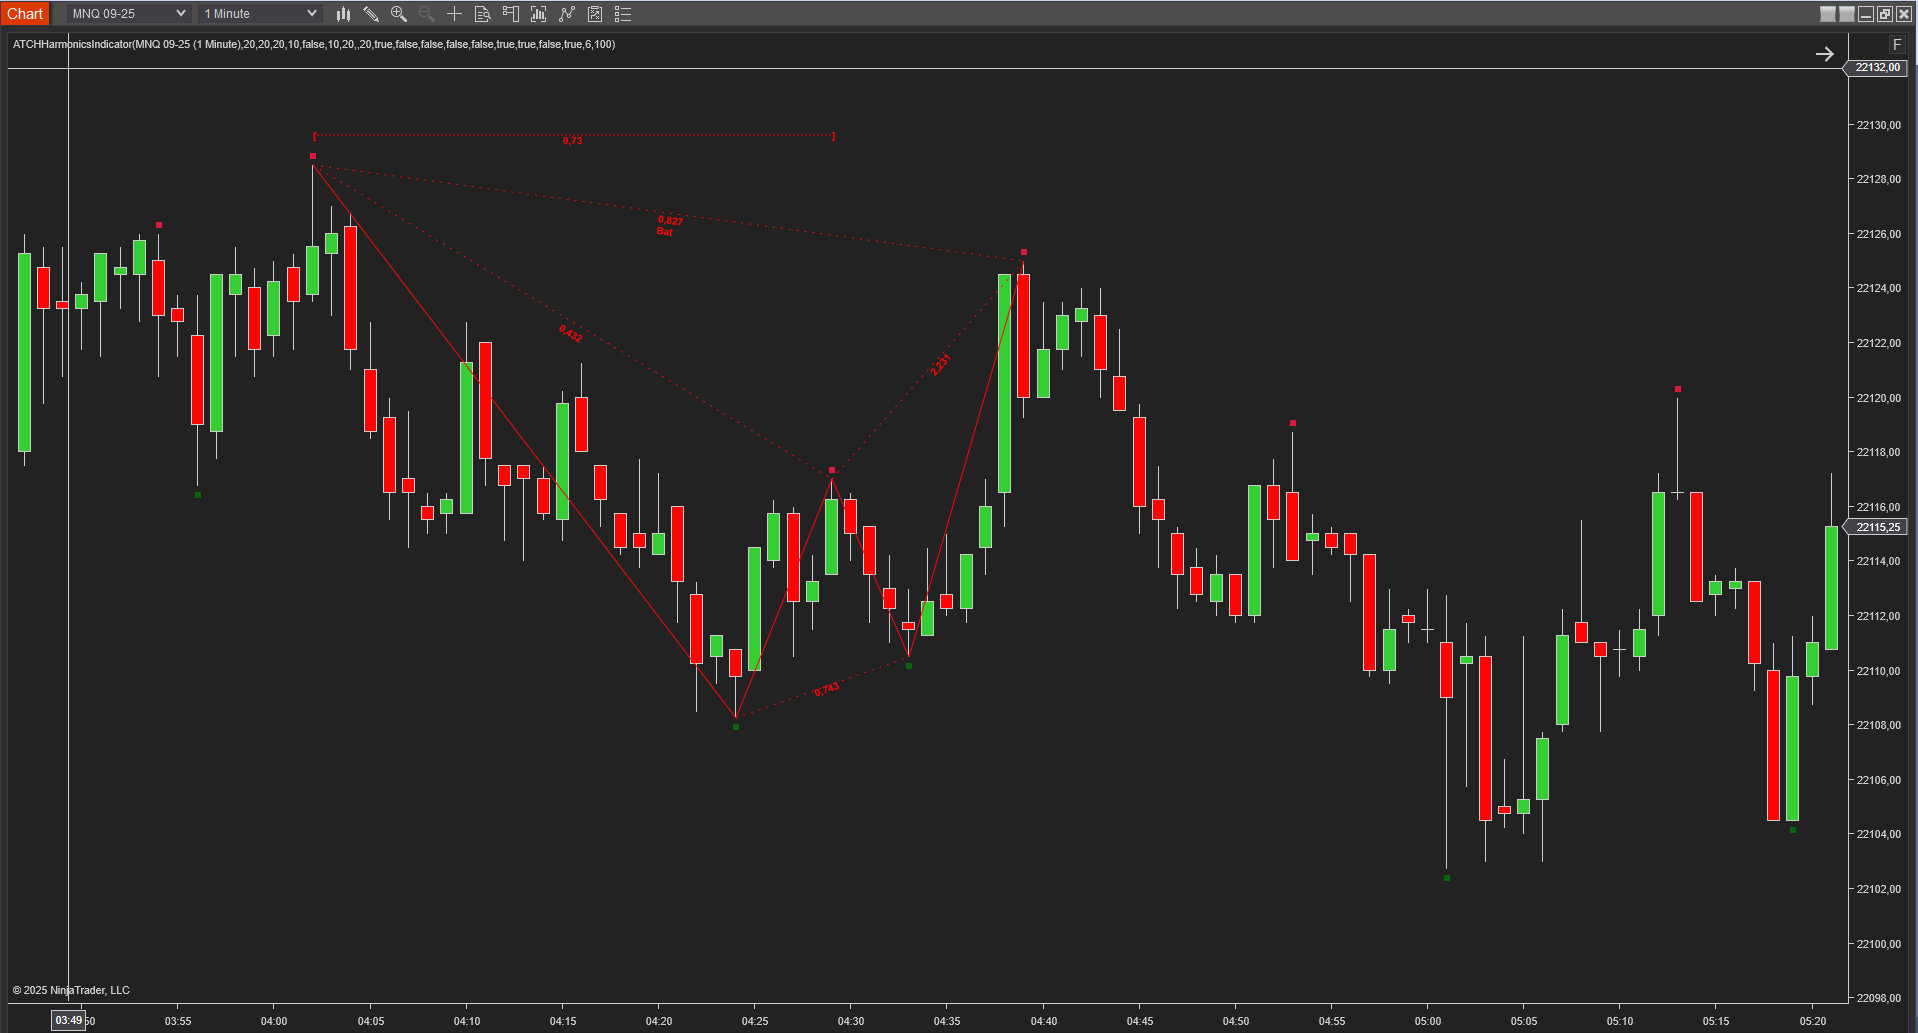
The above example shows a Bat pattern example. For an entry, one can wait for a red candle confirmation after the formation of the pattern. And target the point A or the point C
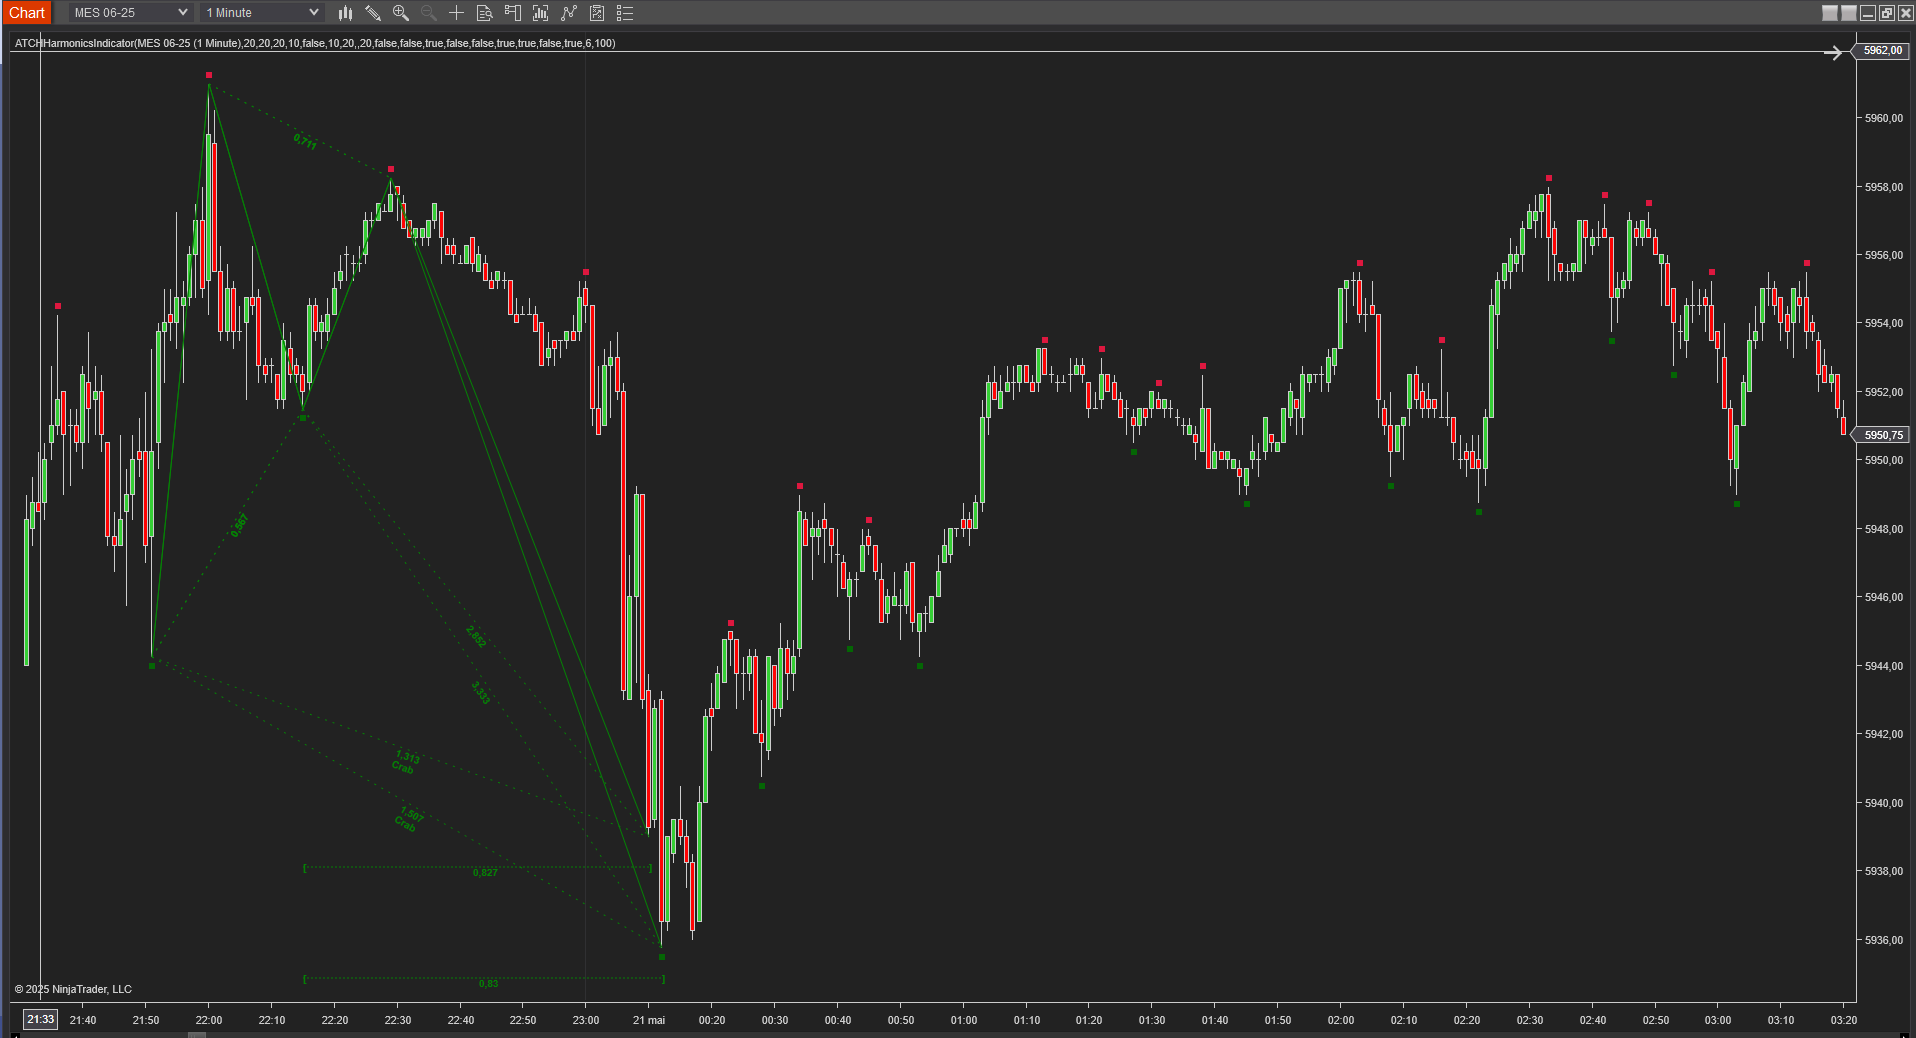
The above example shows a Crab pattern example. For an entry, one can wait for a green candle confirmation after the formation of the pattern. And target the point A or the point C. You can also notice that the indicator recognozed and printed two patterns overlapping X, A, B and C swings points, but have different D point. This is something that can happen as those two patterns are valid patterns. In the context of live trading, the second pattern can be seen as a confirmation signal to the first one.
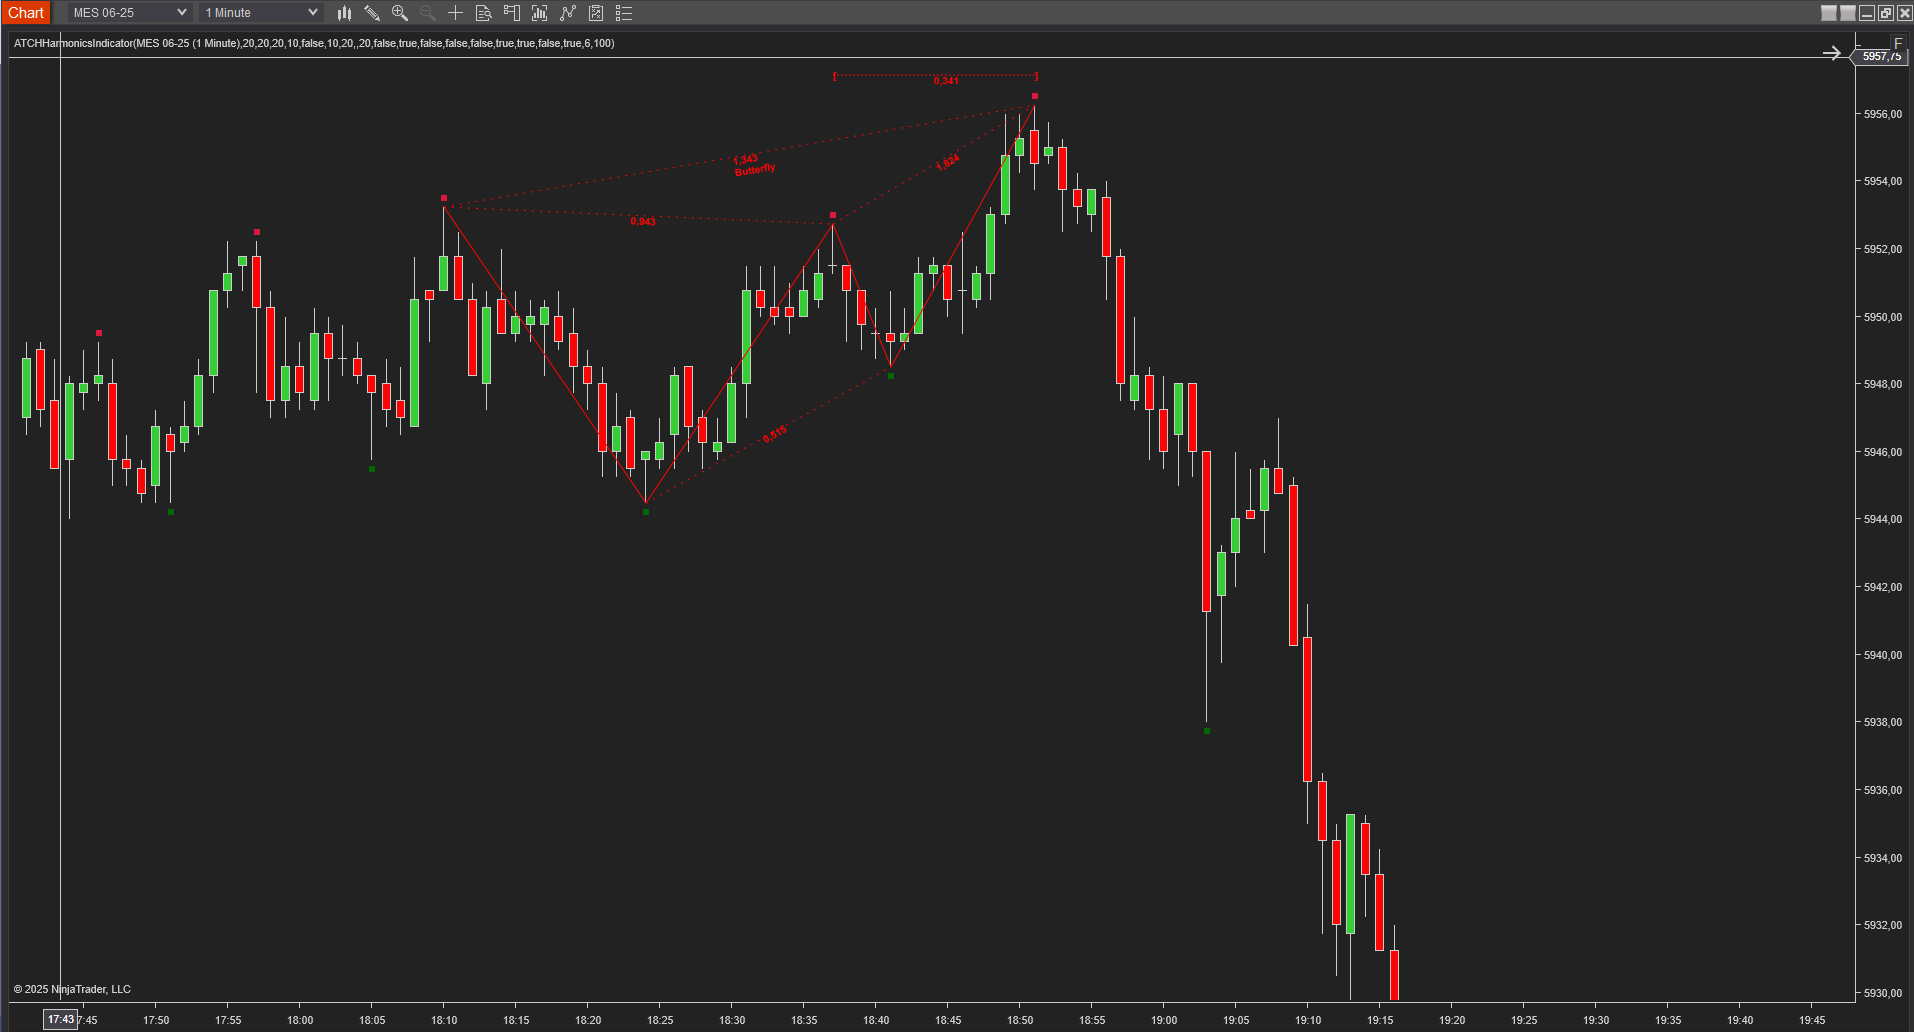
The above example shows a Butterfly pattern example. For an entry, one can wait for a red candle confirmation after the formation of the pattern. And target the point A or the point C. The butterfly is the least effective pattern because it ends with a price action opposite to the wanted trade direction. So be careful with it.

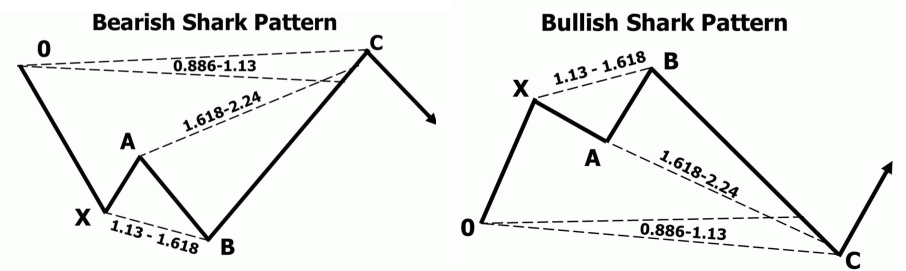
The above example shows a bullish Shark pattern example. For an entry, one can wait for a red candle confirmation after the formation of the pattern. And target the point A or the point C
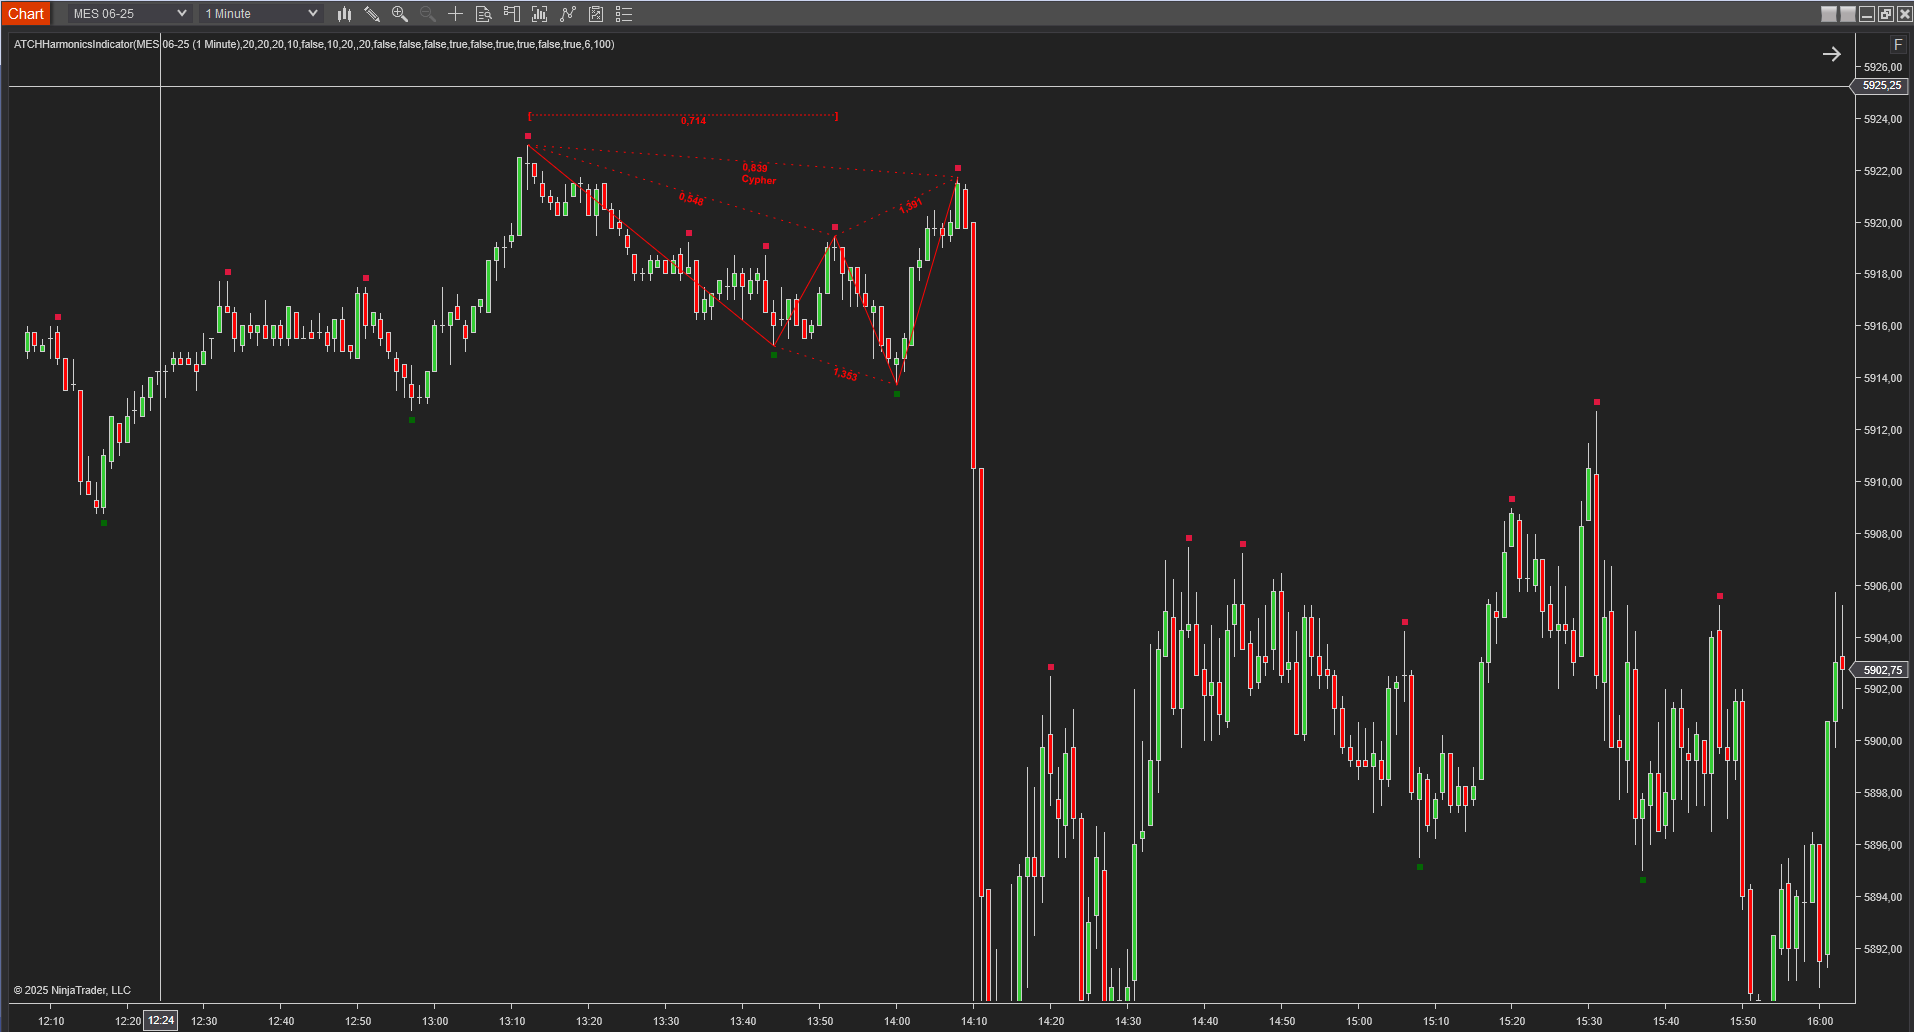
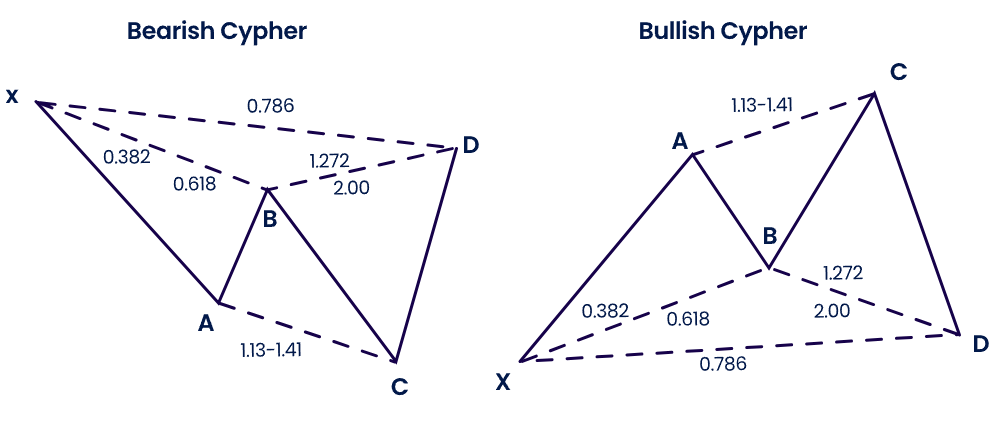
The final example is the cypher pattern example
Parameters
We always try to keep the parameters to minimum.
| License | |
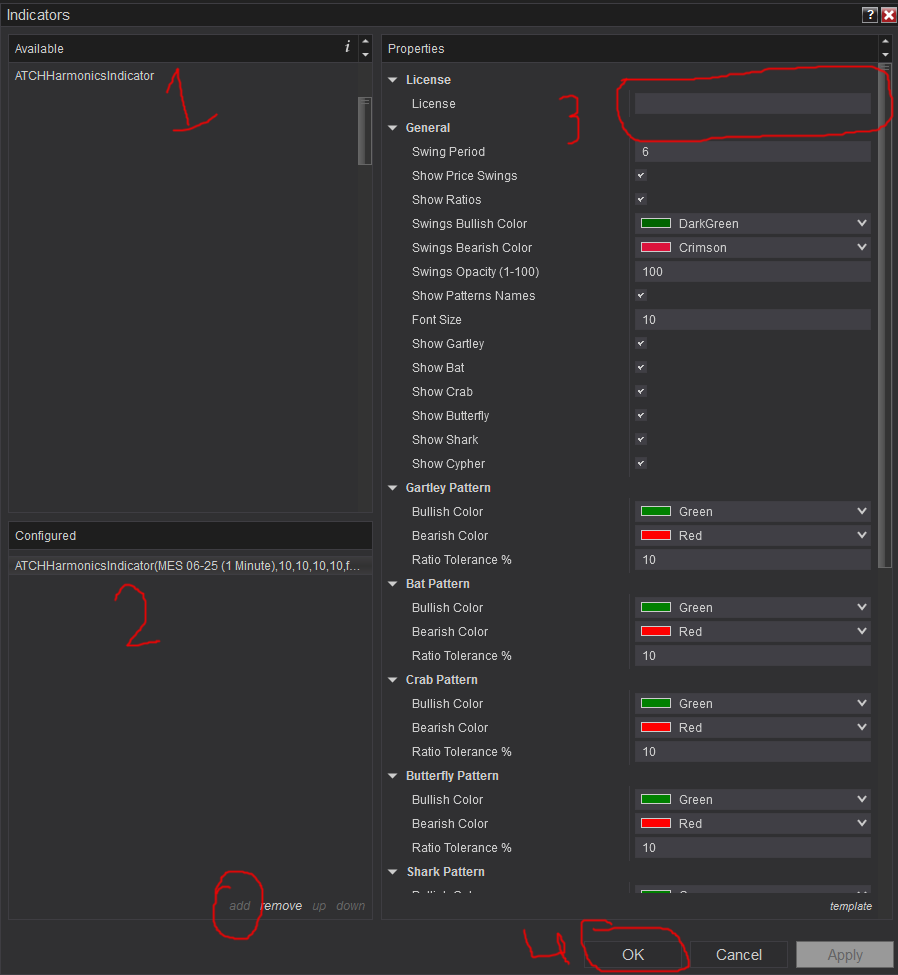
| License | This is the license key you get when you create an account on automated-trading.ch. After creating an account, copy your license key from the billing page. You need to set this parameter only once per month, once the license key is validated it will be remembered for the rest of the month. |
| General | |
| Swing Period | Swings are higher lows,higher highs, lower highs and lower lows. After each price bar close, a swing can take place. But just after that, the next bar can cancel the swing at the previous bar by creating a new swing of the same type. Or this can happen on the second bar, or the third, etc... The swing period sets how many bars is enough to seperate two swings of the same type. The more you increase this parameter, the more you decrease the number of swings overall. The more you decrease this parameter, the more you increase the number of overall swings. As you can see this parameter has a big impact on the patterns that are detected, when you set this to a small value, swing points will be close to each other and the patterns will be condensed, inversly when the value of this parameter is high, the patterns will be wide and big. |
| Show Price Swings | This parameter will control showing/hiding the swing points |
| Swings Bullish Color | When shown, this parameter will set the color of bullish swings |
| Swings Bearish Color | When shown, this parameter will set the color of bearish swings |
| Swings Opacity (1-100) | This parameter sets the opacity from 1 to 100 to draw the swing markers |
| Show Ratios | This parameter will enable drawing ratio lines between the pattern legs with a dashed line and drawing the ratio number on it. |
| Show Patterns Names | This option will enable drawing the pattern name |
| Font Size | This parameter sets the Font size |
| Show Gartley | Enable/Disable drawing or not Gartley patterns |
| Show Bat | Enable/Disable drawing or not Bat patterns |
| Show Crab | Enable/Disable drawing or not Crab patterns |
| Show Butterfly | Enable/Disable drawing or not Butterfly patterns |
| Show Shark | Enable/Disable drawing or not Shark patterns |
| Show Cypher | Enable/Disable drawing or not Cypher patterns |
| Gartley Pattern | |
| Bullish Color | This sets the color to draw bullish Gartley patterns on the chart |
| Bearish Color | This sets the color to draw bearish Gartley patterns on the chart |
| Ratio Tolerance % | This sets the tolerance in percentage on the Legs ratio rules. When this value is set to 10 for example, it means that the recognition algorithm will apply a 10% tolerance on the ratio set for legs, if for example a leg ratio should be around 0.368, by applying 10% tolerance, the actual leg ratio can be between (0.368 + 10%) and (0.368 - 10%) |
| Bat Pattern | |
| Bullish Color | This sets the color to draw bullish Bat patterns on the chart |
| Bearish Color | This sets the color to draw bearish Bat patterns on the chart |
| Ratio Tolerance % | ...See description above on the Gartley pattern |
| Crab Pattern | |
| Bullish Color | This sets the color to draw bullish Crab patterns on the chart |
| Bearish Color | This sets the color to draw bearish Crab patterns on the chart |
| Ratio Tolerance % | ...See description above on the Gartley pattern |
| Butterfly Pattern | |
| Bullish Color | This sets the color to draw bullish Butterfly patterns on the chart |
| Bearish Color | |
| Ratio Tolerance % | ...See description above on the Gartley pattern |
| Shark Pattern | |
| Bullish Color | This sets the color to draw bullish Shark patterns on the chart |
| Bearish Color | This sets the color to draw bearish Shark patterns on the chart |
| Ratio Tolerance % | ...See description above on the Gartley pattern |
| Cypher Pattern | |
| Bullish Color | This sets the color to draw bullish Cypher patterns on the chart |
| Bearish Color | This sets the color to draw bearish Cypher patterns on the chart |
| Ratio Tolerance % | ...See description above on the Gartley pattern |
| Sound Alert | |
| Play Sound Alert | This parameter will enable playing and alert sound when a pattern is detected |
| Play Sound File | This parameter will set the file name to be played on sound alert. This can be set to any .wav file on your computer |
Download & Installation Instructions
To download and install the indicator follow the instructions below
- Click on the below download button to download the Indicator file
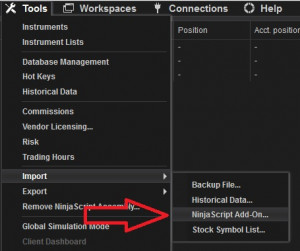
- Import the downloaded .zip file into NinjaTrader using the import NinjaScript menu item
- Next, open a new chart window
- After installing the indicator and opening a new Chart window you should add the indicator to the chart. Right-click on the chart and click on Indicators...
- Copy/Paste your license key that you can find on the Billing page into the license parameter
- The indicator requires the Premium Subscription. Check the Pricing page for details
- After adding the indicator to the chart with a valid license, the indicator will be run on Historical data loaded on the chart.
- After that, the indicator is added with success and will continue to run on live market data
Frequantly Asked Questions
General
Yes, If you have an idea that you believe can improve this indicator, I will be more then happy to hear from you. Please use the contact page to send me a message
No, the source code of the indicator is protected for copyright reasons
Yes you can use this indicator without TickReplay and without Orderflow
Yes, in some cases, the pattern recognized and drawn on the chart can be removed if they are invalidated on the first following candle. Invalidation means the candle closes below the D swing point for a bullish pattern, and closes above the D swing point for bearish patterns
Release Notes
- First Release of the indicator
User Comments & Feedback
You can find feedback of our users and ask questions about this strategy by joining our discord community by following this invite link or clicking on the Discord logo image. Joining is completely free
![]()