

VWAP Strategy
 Created 01 Nov 2026
·
Updated 01 Nov 2026
The VWAP Strategy is a Premium mechanical strategy for the NinjaTrader 8 platform. It trades pullbacks in the direction of the intraday trend defined by a higher-timeframe VWAP. The strategy can be used to pass trader funding programs.
Prerequisites
To properly use this strategy you should have the following prerequisites available.
- NinjaTrader 8, with any license type. Click here to download
- The ATCH.NinjaTrader library (ATCH.NinjaTrader.zip), downloadable from the Installation section below.
- An automated-trading.ch account with an active Premium Subscription
Important Disclaimer
We strongly recommend that you never run your algorithmic trading systems on your hard-earned real money. You should always minimize your risk and run your strategies on trader funding programs, so the maximum amount you risk losing is the monthly subscription fee you pay those programs.
Strategy Overview
The VWAP Strategy follows the intraday trend defined by the Volume Weighted Average Price (VWAP). Every day the VWAP is calculated over a configurable window (regular trading hours, 09:30–16:00 Eastern, by default) from the candles of a higher timeframe (15 minutes by default), starting from the first higher-timeframe candle of the window.
On every closed bar of the chart (the execution timeframe) the strategy checks whether a long or a short setup should be armed. A long setup is armed when, inside the trading session, the bar closes above the VWAP, the VWAP is rising (its last value is higher than the previous one), and the price is still below the upper std1 band. A short setup is the mirror image: the close is below a falling VWAP and above the lower std1 band.
Once a setup is armed, the strategy waits for its trigger candle — a pullback against the trend — and enters in the direction of the trend.
The strategy is based on the assumption that, in a trending regular trading hours (RTH) session, the price climbs up or down the trend around the VWAP level and its std1 bands. It waits for the price to show a sign of a trend by calculating the price change %, and when the price pulls back inside the upper or lower std1 band, it fires a trade.
Entry Setup Examples
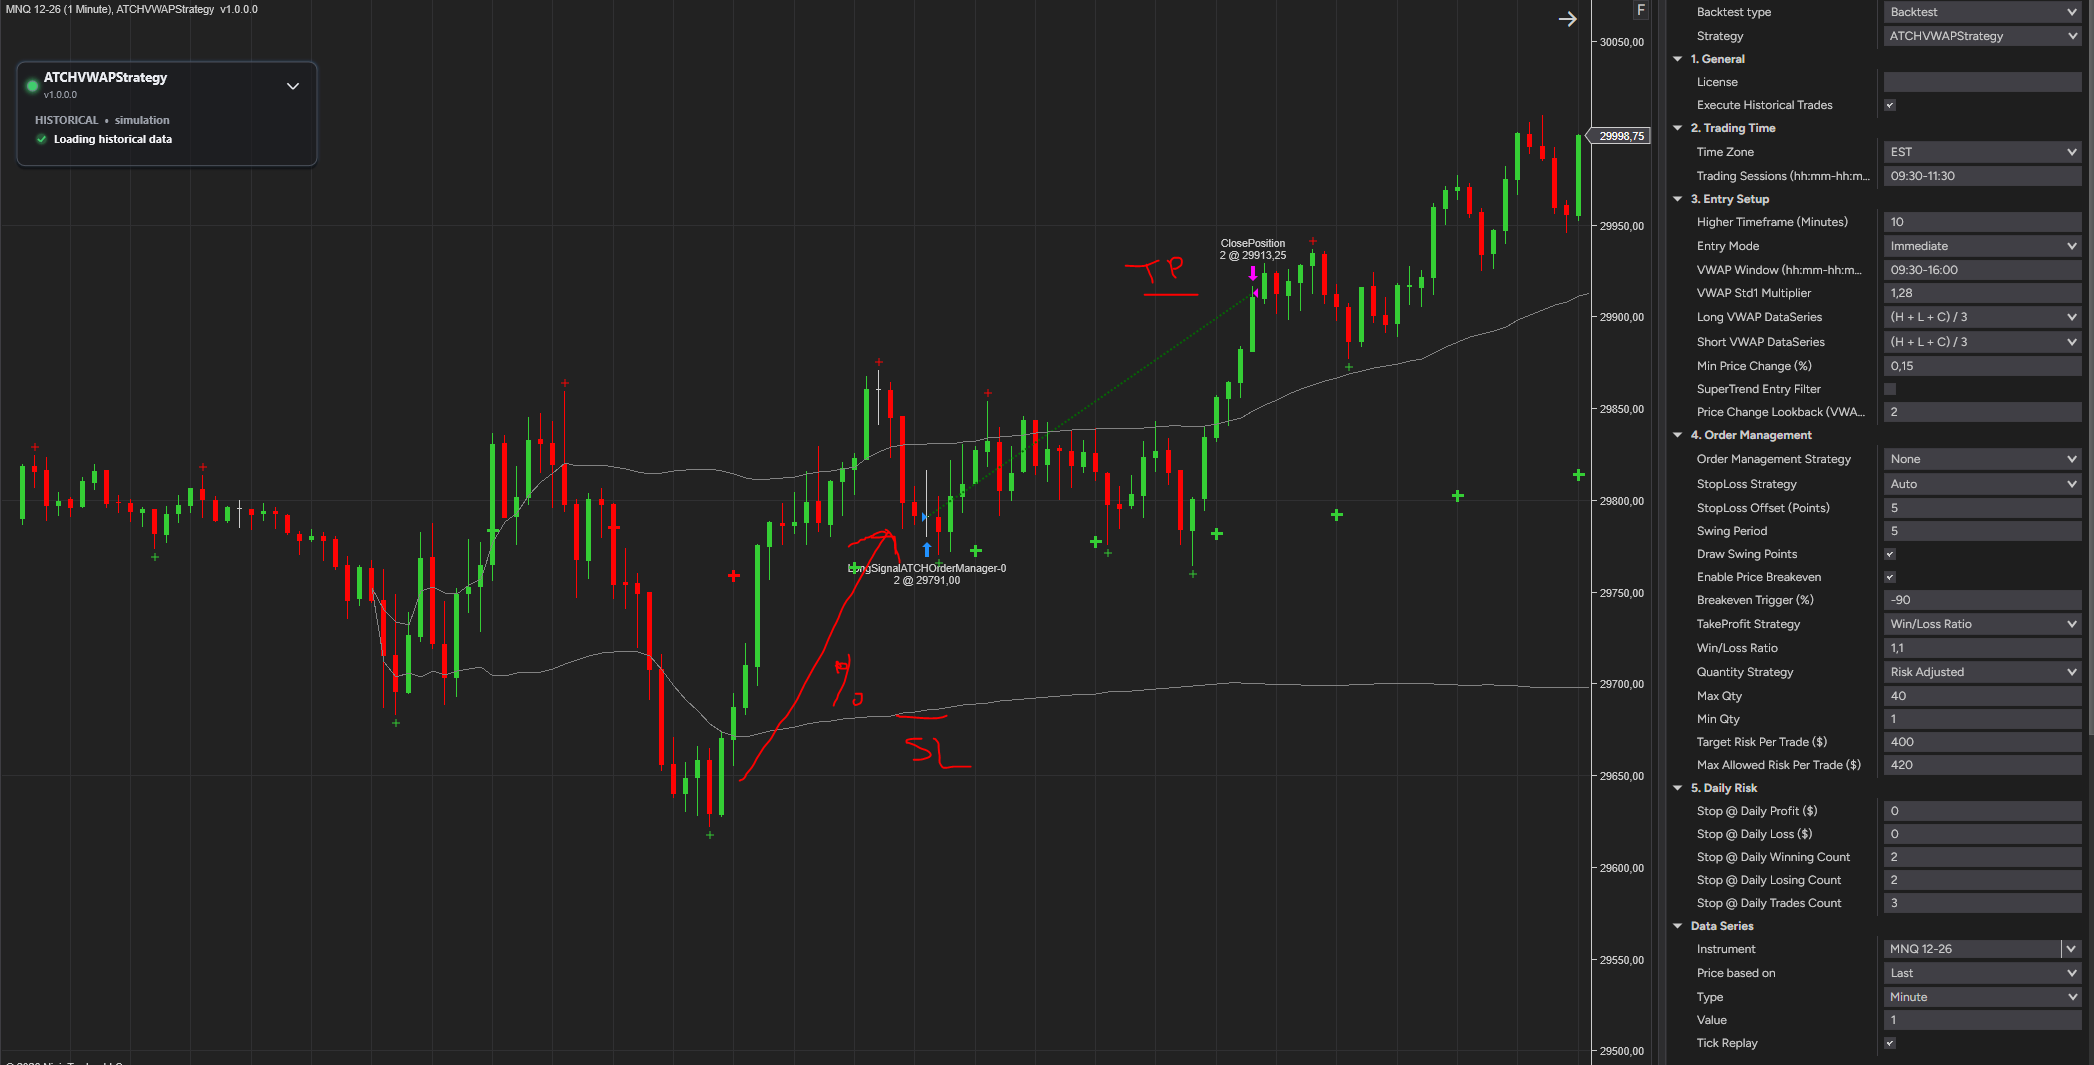
Example #1: Long Entry After a Rising VWAP and a Pullback Candle on MNQ
On MNQ, with a 10-minute higher timeframe for the VWAP, the price closes above a rising VWAP and below the upper std1 band, which arms the long setup. As illustrated on the image, the price change at the entry bar and two VWAPs before is higher than 0.15%, which is the Min Price Change (%) threshold required to trigger an entry. The first red pullback candle then triggers the long entry. The stop loss is placed at the lower std1 band, and the take profit at 110% of the stop loss distance (a 1.1:1 win/loss ratio).
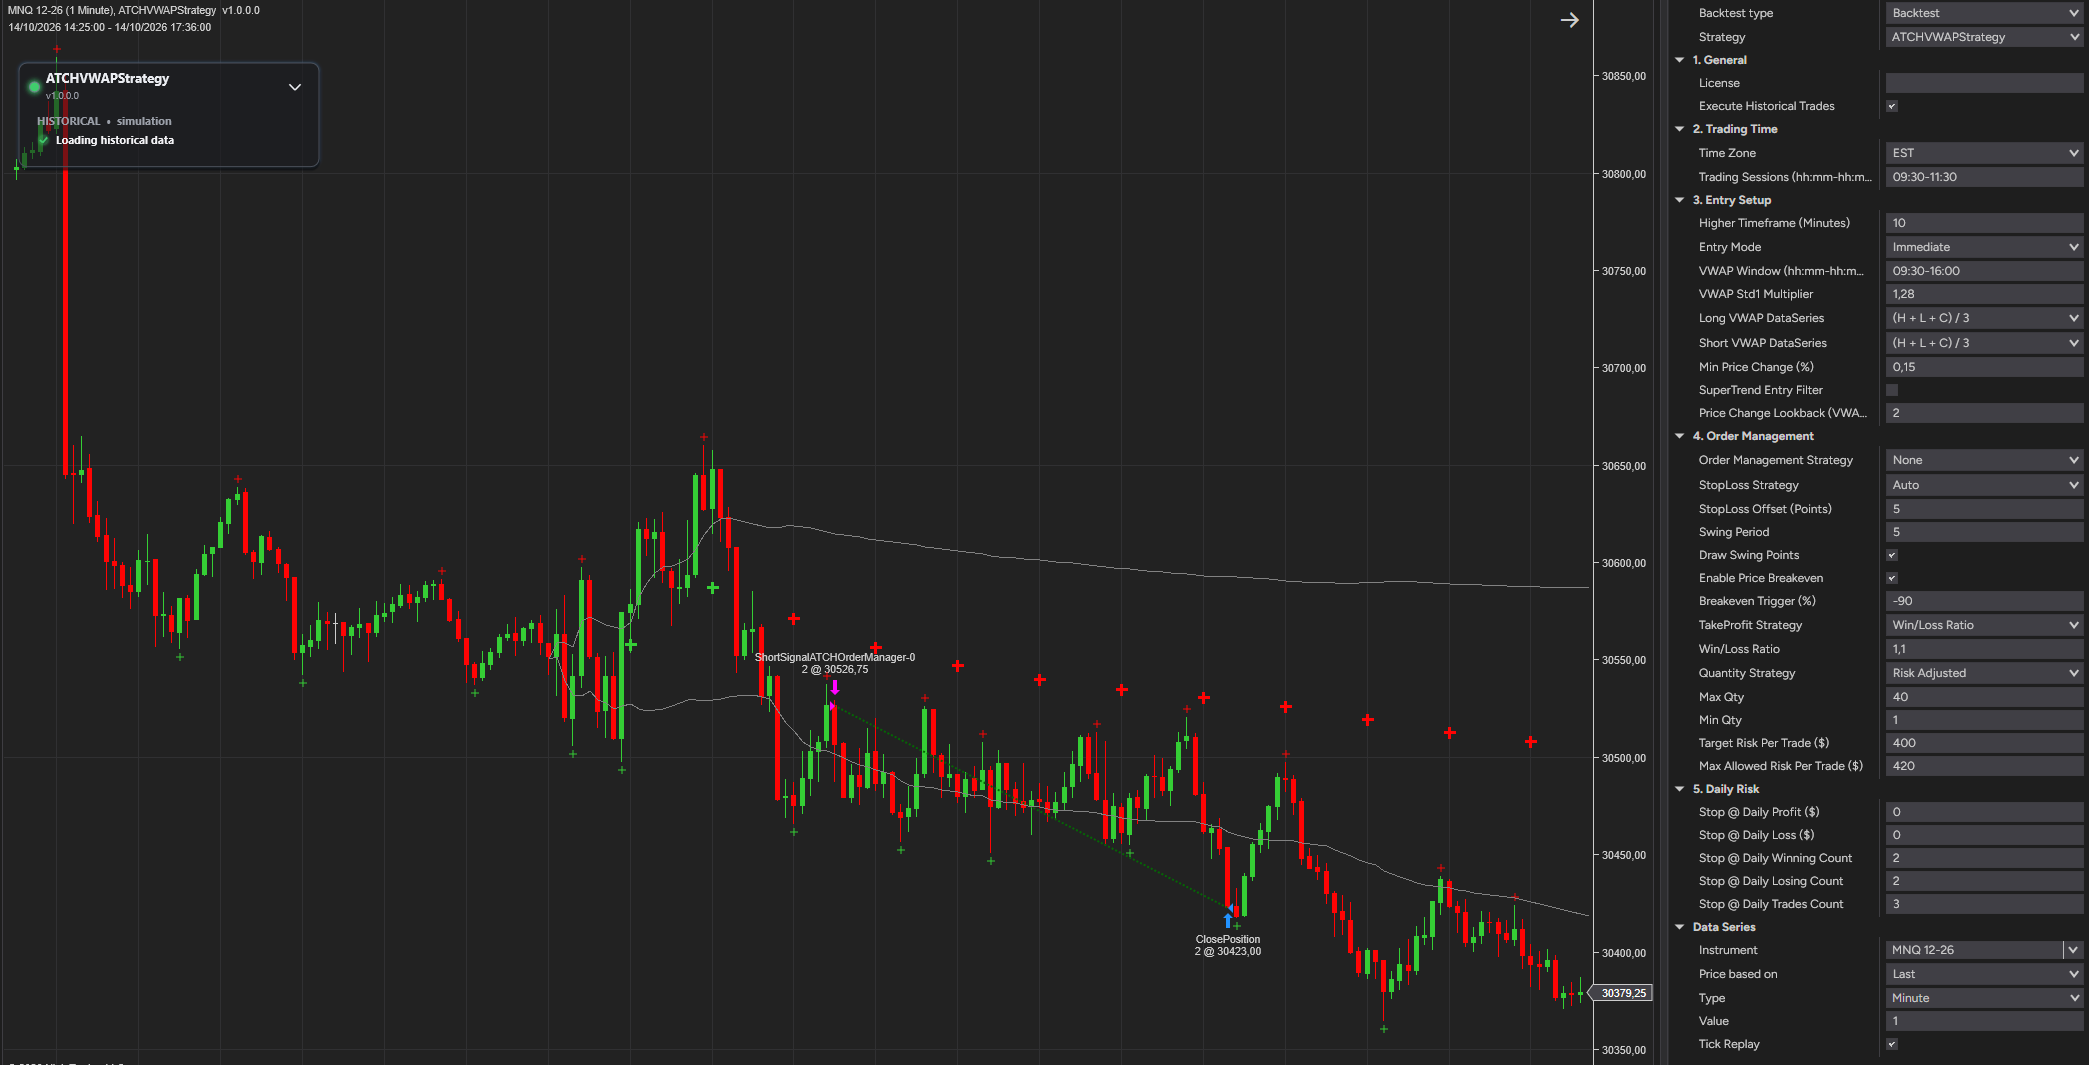
Example #2: Short Entry Below a Falling VWAP on MNQ
The mirror image: the price closes below a falling VWAP and above the lower std1 band, the short setup is armed, and the first green pullback candle triggers the short entry in the direction of the trend.
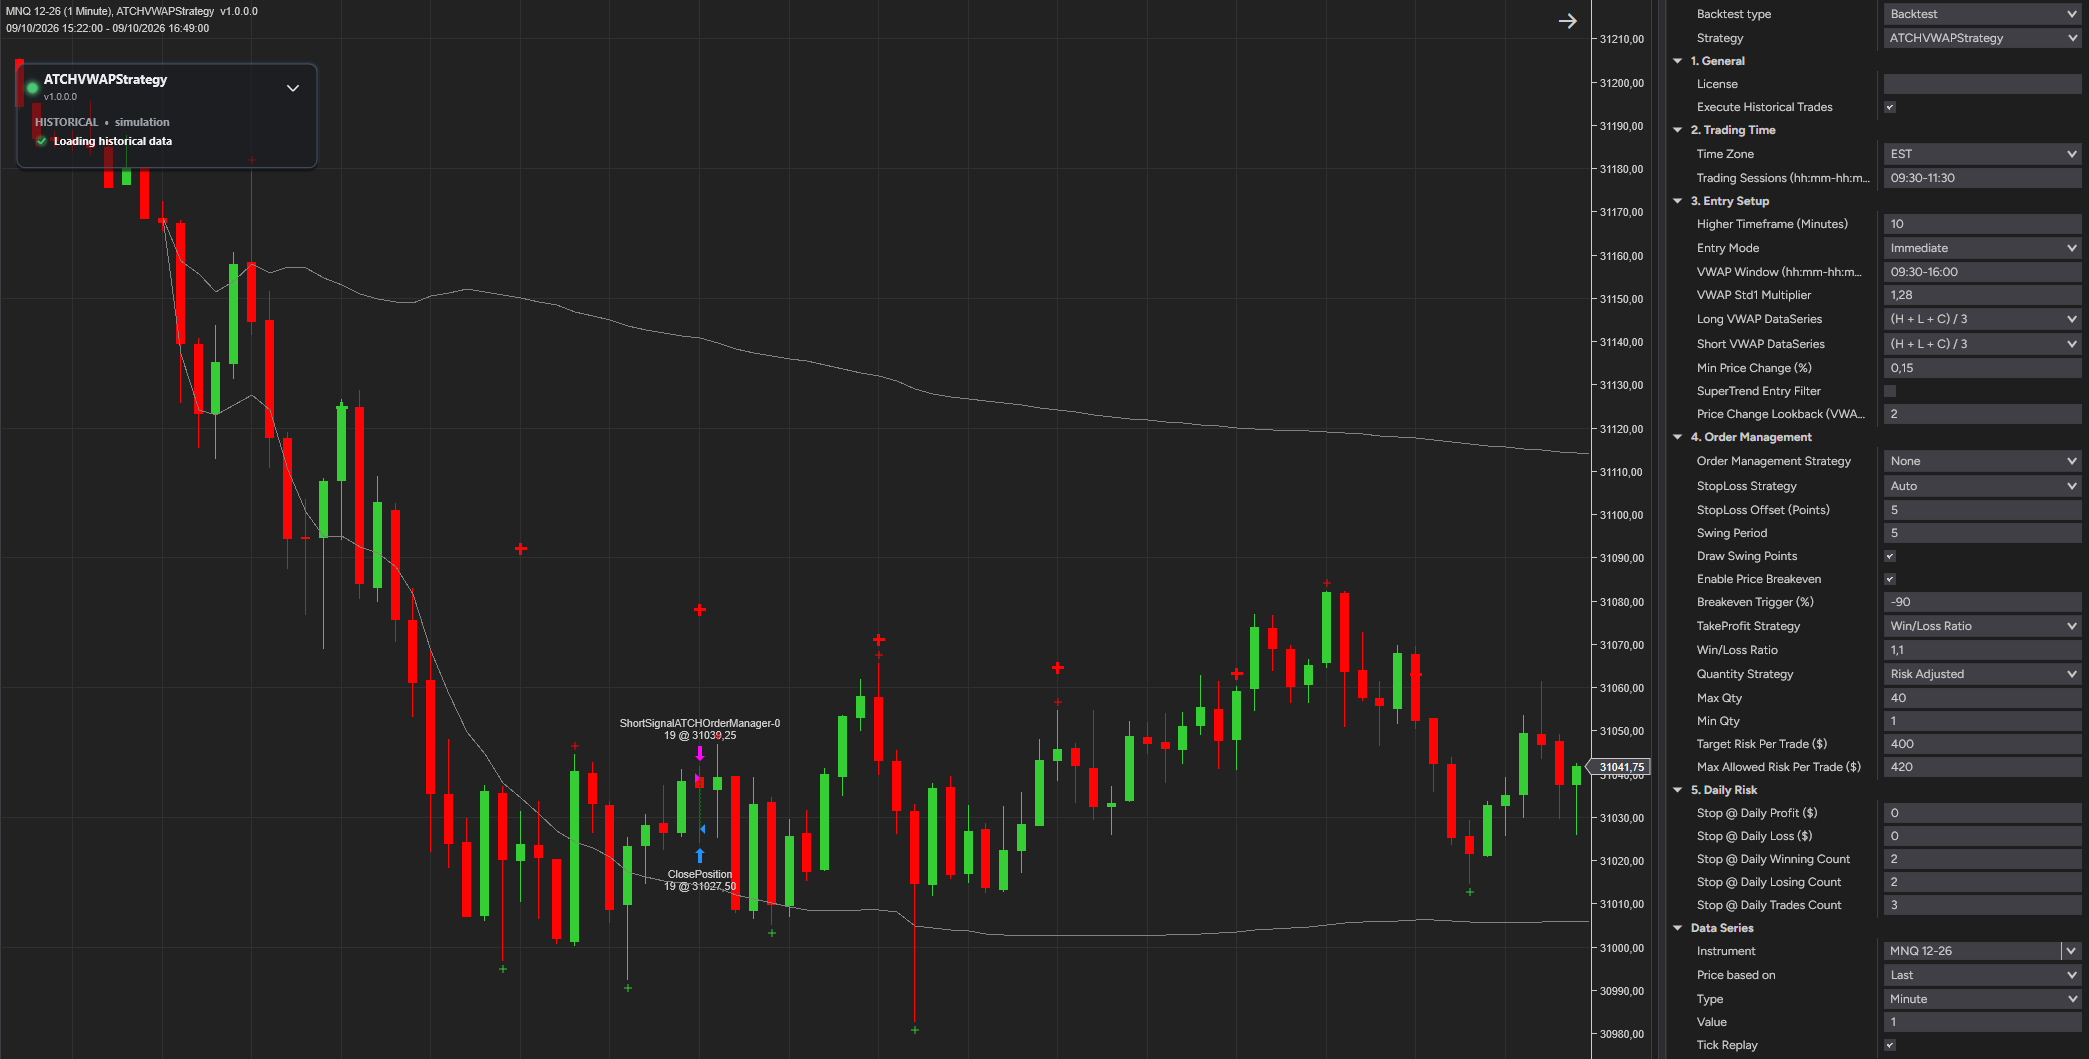
Example #3: Tight Stop Loss on the Last Swing High With the Auto Stop Loss Mode on MNQ
This example shows a case where the Auto stop loss mode sets this entry's stop loss on the last higher-high swing point. This is based on an internal calculation driven by the Risk settings. The stop loss is tight, and the take profit was hit even though the down trend was not strong.
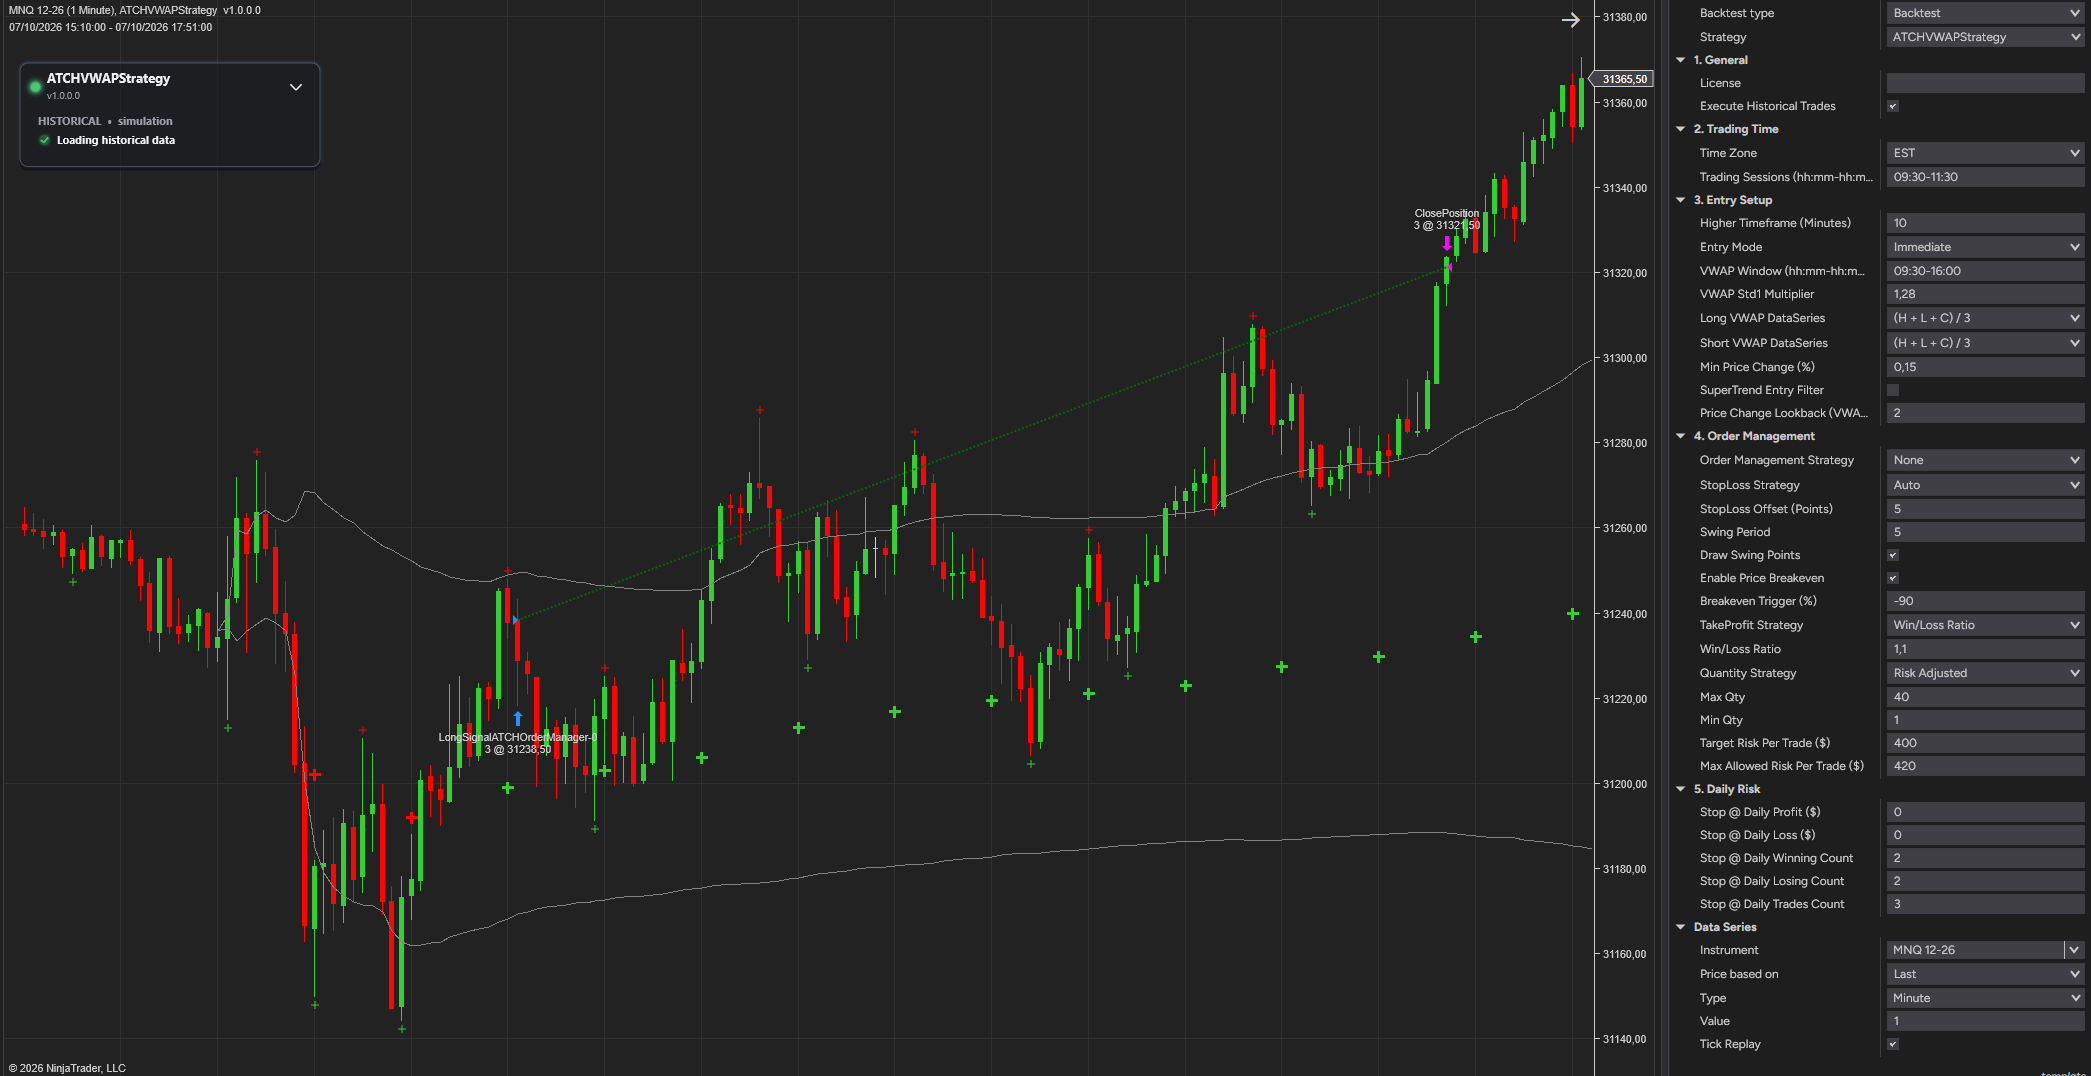
Example #4: Clean Long Entry on the First Red Pullback Candle on MNQ
This example shows a clean long entry. The entry was triggered at the first red candle pullback below the std1 that respected the 0.15% price change.
Example #5: A Two-Trade Day With a Breakeven Protecting the Second Trade on MNQ
This shows a two-trade day. The first trade was a clean long trade. Then the long trend lost steam, but the strategy still entered a second long trade, and the price started chopping and dropped close to the stop loss, which was set at the lowest low before the entry bar. The price reached the 90% level of the stop loss and a breakeven was triggered to protect the trade from ending as a loss.
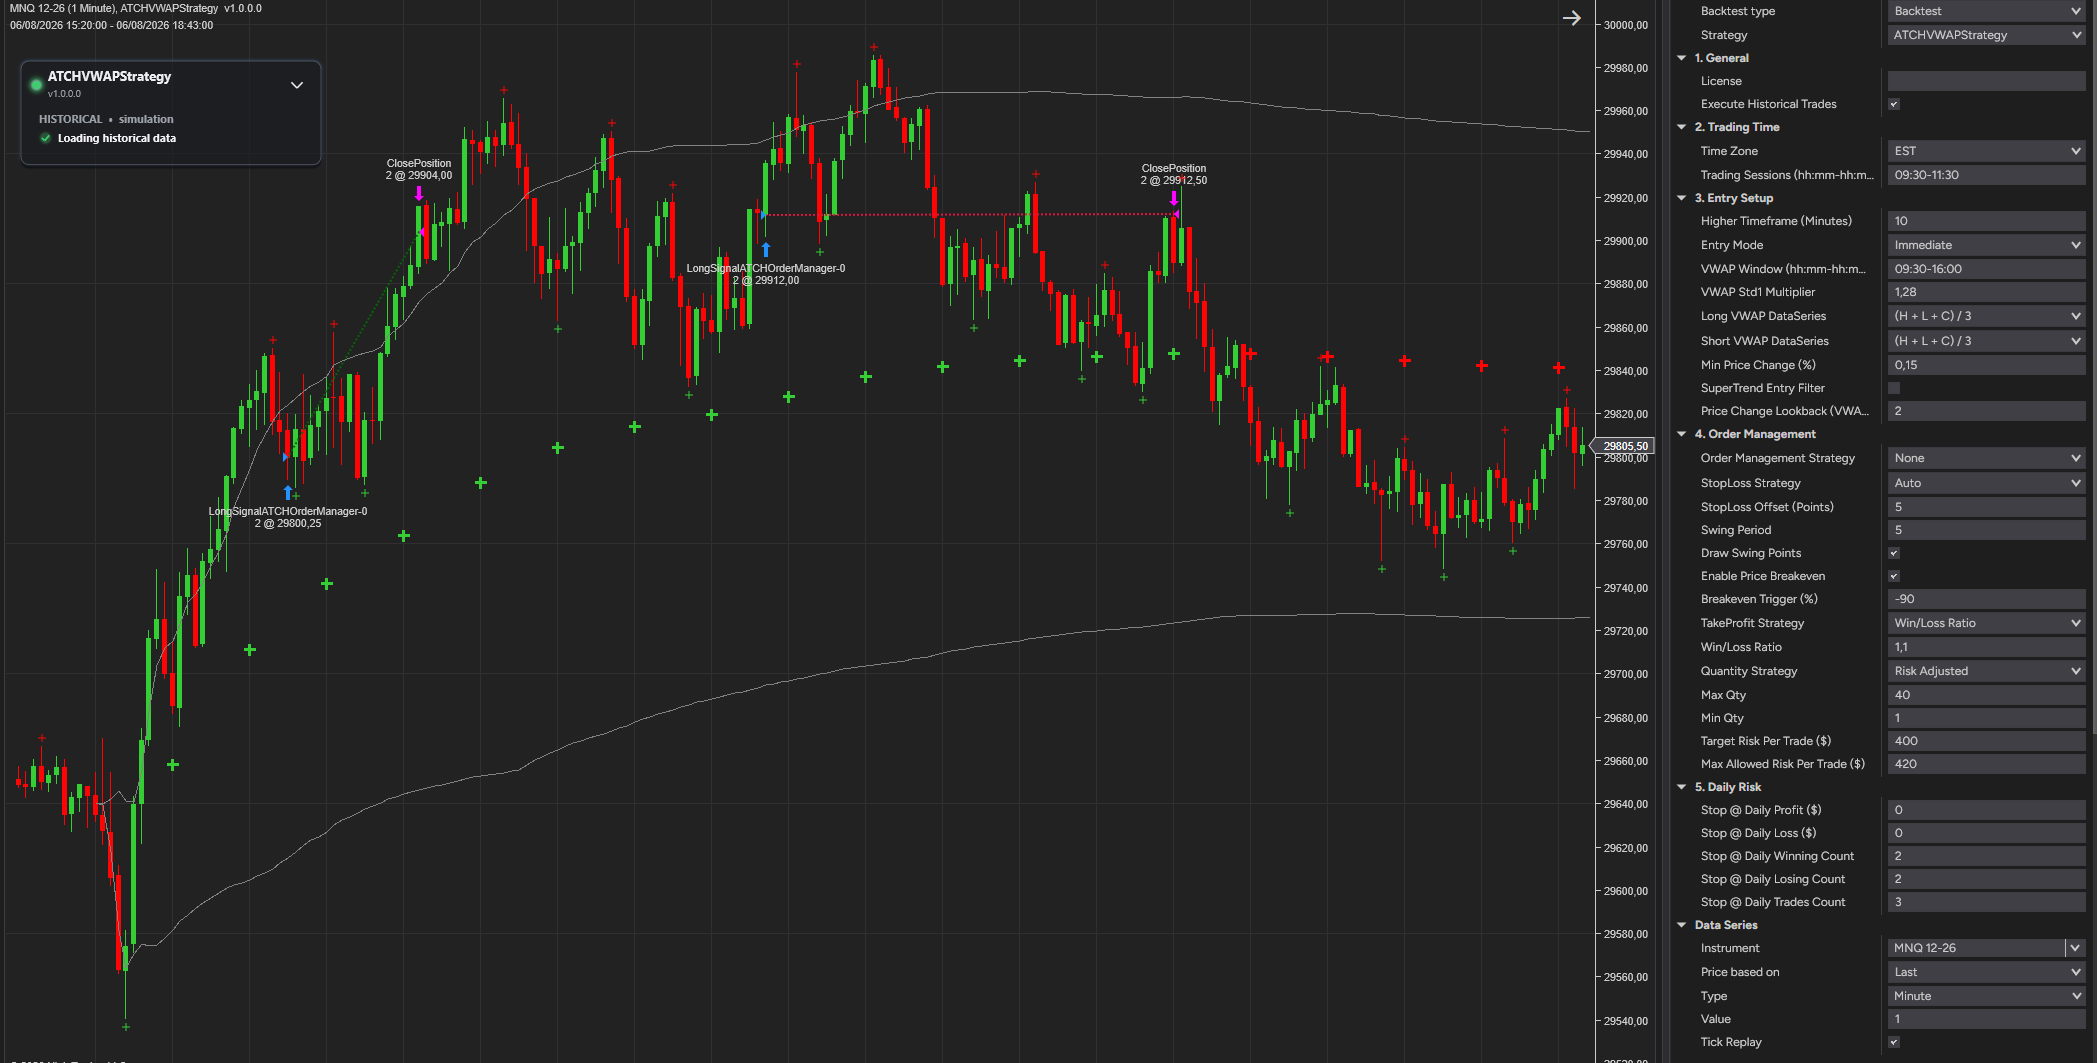
Example #6: A Losing Long Trade on MNQ
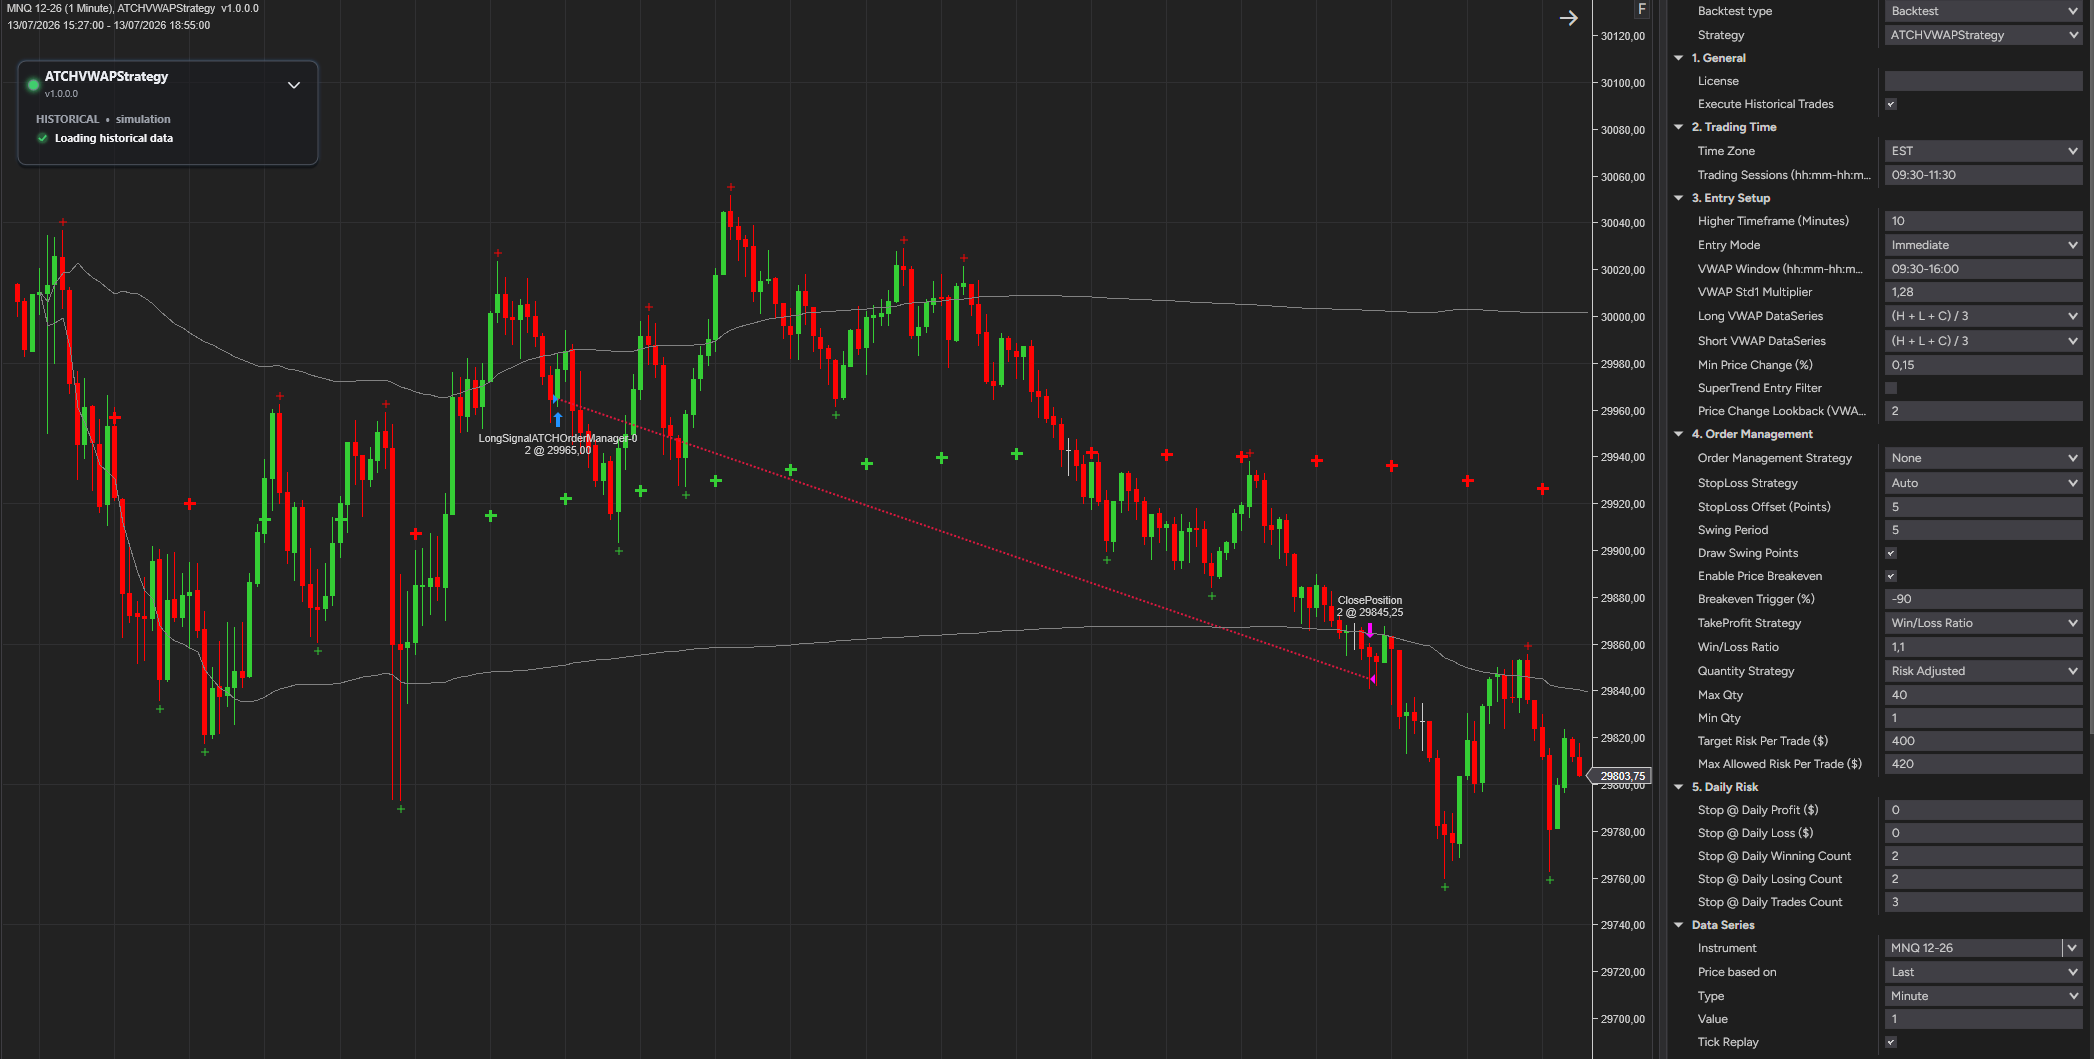
Not every day is a winning day. This example shows a losing long trade. All the entry conditions were met and the price went up, but not enough to reach the take profit. Then the price dropped and hit the stop loss.
The backtest gives a wider view of the performance, which is positive. But real-life day-to-day trading is full of losing streaks, and some traders cannot accept losing days or losing weeks. This is what makes the difference between profitable and non-profitable systematic traders.
Features
The VWAP Strategy has a set of unique features:
- Trades with the trend of a higher-timeframe, volume-weighted VWAP, with standard-deviation bands as boundaries
- Full-auto strategy that can be scaled into multiple instances (one per instrument)
- Long and short setups with their own VWAP price source each
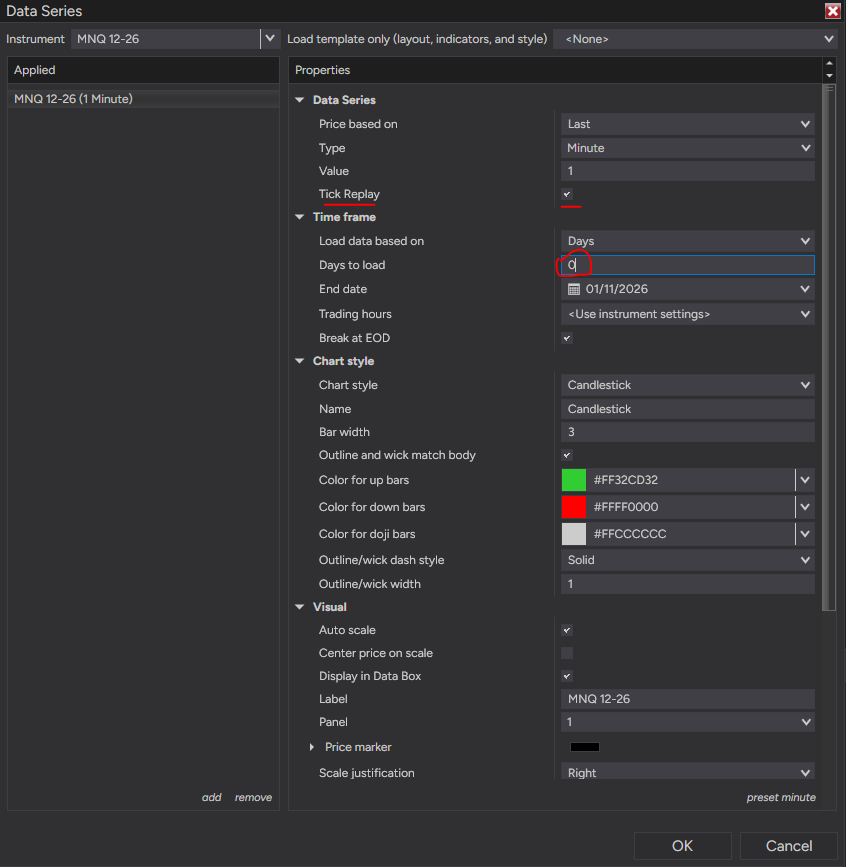
- Intraday tick-level backtesting capabilities, which makes backtesting 99% conformant to real-time performance
- Open positions are closed shortly before the session closes — nothing is held overnight
Dynamic Quantity and Risk Management
As with all our strategies, this strategy implements two methods for setting the quantity of open positions:
- Fixed Quantity: uses the same quantity for every position. If the stop loss is variable between positions, win/loss amounts will vary too.
- Risk Adjusted (the default): calculates each position's quantity from its stop loss and the maximum risk (in $) allowed per position, bounded by a maximum and a minimum quantity — producing similar win/loss amounts across positions regardless of the stop loss width. A calculated quantity below the minimum skips the entry instead of opening an undersized, disproportionately risky trade.
Stop Loss and Take Profit
- Stop loss: VWAP, SuperTrend, last swing point, or an automatic method that picks the nearer of the last swing point and the std1 band — each widened by an optional offset.
- Take profit: a win/loss ratio, a number of points, or a currency amount.
Position Management
- SuperTrend: tightens the stop loss behind each bar once the close has moved beyond the SuperTrend line against the position.
- Price breakeven: moves the stop loss to breakeven once price has gone a chosen share of the way to the target (or, with a negative value, to the stop).
Account Management
The strategy implements daily stop-trading triggers based on a target daily profit or loss, the winning trade count, the losing trade count, or the total number of trades taken.
Parameters
We try to keep the parameters to a minimum — only the most important are exposed.
| 1. General | |
| License | Your license key (found on the billing page). It is never saved in templates or workspaces, so sharing a template can't leak it. Once the key validates it is stored in a local license file that is read on every start — this parameter only has to be filled in the first time. You can also paste the key into the strategy status card on the chart instead. |
| Execute Historical Trades | Enables executing trades when the strategy runs in Historical mode — useful to test performance on past days, but should be unchecked when running Live. |
| 2. Trading Time | |
| Time Zone |
The time zone used for the Trading Sessions parameter below.
|
| Trading Sessions (hh:mm-hh:mm,...) | The time intervals during which the strategy is allowed to look for entries — e.g. 09:30-16:00 (the default) or "09:30-11:30,13:30-15:30". An invalid value is reported on the strategy status card and the strategy does not trade. |
| 3. Entry Setup | |
| Higher Timeframe (Minutes) | The timeframe, in minutes, the VWAP is calculated on (15 by default). It is converted to a number of chart bars per higher-timeframe candle — a 15-minute value on a 5-minute chart means three bars per candle. On a chart that is not time-based (tick, range, volume...) the value is used as the number of chart bars per candle. |
| VWAP Window (hh:mm-hh:mm, Eastern) | The daily interval, in Eastern time, the VWAP is calculated over — regular trading hours by default (09:30-16:00). It anchors at the first higher-timeframe candle inside the interval each day and stops accumulating when candles leave it. |
| VWAP Std1 Multiplier | The multiplier of the first standard-deviation band of the VWAP: the band is the VWAP plus or minus this times the volume-weighted standard deviation (1.28 by default). A long needs the price below the upper std1 band, a short above the lower one. |
| Entry Mode |
How the entry triggers once the setup is armed.
|
| Long VWAP DataSeries / Short VWAP DataSeries |
The price each bar contributes to the VWAP used by long trades and by short trades (HLC3 by default). When both are the same, one VWAP serves both directions.
|
| Min Price Change (%) | The minimum change, in percent, of the close of the trigger bar against the close of the last closed higher-timeframe candle: a long needs at least +this, a short at most -this. Checked right before the entry is sent. 0 switches the condition off (0.1 by default). |
| Price Change Lookback (VWAP Points) | Only visible when Min Price Change (%) is above 0 — which VWAP point the price change is measured from: 1 is the last closed higher-timeframe candle, 2 the one before it, and so on. |
| SuperTrend Entry Filter | When checked, a long only fires while the SuperTrend line is green (bullish) and a short only while it is red (bearish), checked on the bar that just closed; otherwise the trigger is aborted. |
| 4. Order Management | |
| Order Management Strategy |
|
| StopLoss Strategy |
Where the initial stop loss goes. Every method is widened by StopLoss Offset (Points).
|
| StopLoss Offset (Points) | Added below (long) or above (short) the stop loss price computed by the method above, widening it. Also used by the SuperTrend order management method. |
| Swing Period | Only visible with the Last Swing Point or Auto stop loss — the number of bars required on each side of a swing bar (5 by default). |
| Draw Swing Points | Only visible with the stop loss methods above — draws the swing points the stop loss uses on the chart. |
| Enable Price Breakeven | When checked, an open trade is moved to breakeven once price reaches the Breakeven Trigger (%). |
| Breakeven Trigger (%) | Only visible when price breakeven is enabled — where price must be, from -100 to 100 percent. A positive value is a share of the way from the entry to the take profit (50 = halfway to the target; needs a price take profit). A negative value is a share of the way from the entry to the stop loss, on the losing side (-90 = price has gone 90% of the way to the stop). |
| TakeProfit Strategy |
|
| Win/Loss Ratio | Only visible with the Win/Loss Ratio take profit strategy — e.g. 2 targets a 2:1 ratio. |
| TakeProfit Points / TakeProfit Currency | Available when the take profit strategy is Points or Currency respectively (10 points and $200 by default). |
| Quantity Strategy |
|
| Order Qty | Only visible with the Fixed Quantity strategy — the fixed quantity per trade. |
| Max Qty | Only visible with the Risk Adjusted strategy — the maximum allowed quantity (6 by default), useful since some prop firms enforce order-quantity limits that can invalidate an account. 0 means no limit. |
| Min Qty | Only visible with the Risk Adjusted strategy — the minimum calculated quantity a trade is allowed to open with (1 by default). A calculated quantity below it (typically from a very wide stop loss) skips the entry. 0 disables the check. |
| Target Risk Per Trade ($) | Only visible with the Risk Adjusted strategy — the risk, in dollars, each position is sized for (100 by default). |
| Max Allowed Risk Per Trade ($) | Only visible with the Risk Adjusted strategy — how far the real calculated risk is allowed to go above the target (120 by default), since an exact match is rarely possible. |
| 5. Daily Risk | |
| Stop @ Daily Profit ($) | The strategy stops for the day once this daily profit is reached. Ignored when set to 0. |
| Stop @ Daily Loss ($) | The strategy stops for the day once this daily loss is reached (positive value). Ignored when set to 0. |
| Stop @ Daily Winning Count | Stops trading for the day once the winning-trade count reaches this value. Ignored when set to 0. |
| Stop @ Daily Losing Count | Stops trading for the day once the losing-trade count reaches this value. Ignored when set to 0. |
| Stop @ Daily Trades Count | Stops trading for the day once this number of trades has been taken, whether they won or lost. Ignored when set to 0. |
| 6. SuperTrend | |
| Only visible when the SuperTrend is actually used — by the SuperTrend entry filter, the SuperTrend stop loss or the SuperTrend order management method. | |
| SuperTrend Mode | ATR-based, or Adaptive. |
| Period / Multiplier / Moving Avg. Type / Smooth | Standard SuperTrend calculation parameters — period (14), band multiplier (2.618), moving-average type (HMA) and smoothing period (14). |
| Strategy Status Card (drawn on the chart) | |
| The status and the manual command buttons live on a card drawn over the chart panel. Drag the card by its header to move it; collapse it to keep only the header and a one-line summary (the buttons are hidden while it is collapsed). | |
| Header | The strategy name, its installed version, and a New Release Available notice with the version number whenever a newer release exists. |
| License status | The license state: valid, valid (offline), checking, not activated, denied or cannot verify. While the strategy still needs a license, a box to paste your license key and an Activate License button appear on the card. |
| Trading Sessions / Timeframes | Shown only when the Trading Sessions parameter, or the Higher Timeframe / VWAP Window parameters, are invalid — they read "invalid" and the strategy does not trade until you fix them. |
| Long / Short Armed Buttons | Manually enable/disable entering long or short trades (they read Armed or Disabled) — useful if you have a directional bias. |
| Set Breakeven Button | Moves the open position's stop loss to breakeven, if doing so would improve it. |
| Qty +1 / Qty -1 Buttons | Adjusts the current active position's quantity by ±1 contract. |
| Close Position Button | Immediately flattens the position on the active instrument without restarting the strategy, which keeps looking for new trades afterward. It sits alone below a divider so a slightly off-target click can't hit it by accident. |
Performance Reports
Past results are not a guarantee of future results. All backtesting results are for indicative purposes only.
- The backtest period wasn't hand-picked to show the best results.
- Commissions are included, using NinjaTrader's Lifetime license commission schema, for realistic results.
- Order fills are resolved at the tick level for precise intrabar backtesting, in both real-time and backtest modes.
MNQ 1 Minute 400$ Risk
Cumulative P&L
| Metric | All | Long | Short |
|---|---|---|---|
| Start Date | 2025/10/01 | — | — |
| End Date | 2026/10/30 | — | — |
| Total Trades | 226 | 101 | 125 |
| Total Net Profit | 17,431.10 | 11,394.60 | 6,036.50 |
| Gross Profit | 53,601.30 | 26,149.50 | 27,451.80 |
| Gross Loss | -36,170.20 | -14,754.90 | -21,415.30 |
| Commission | 848.90 | 348.40 | 500.50 |
| Profit Factor | 1.48 | 1.77 | 1.28 |
| Max Drawdown | -2,262.20 | -1,627.00 | -2,790.00 |
| % Profitable | 54.4% | 59.4% | 50.4% |
| # Winning Trades | 123 | 60 | 63 |
| # Losing Trades | 103 | 41 | 62 |
| Average Trade | 77.13 | 112.82 | 48.29 |
| Average Winning Trade | 435.78 | 435.83 | 435.74 |
| Average Losing Trade | -351.17 | -359.88 | -345.41 |
| Ratio Avg. Win / Avg. Loss | 1.24 | 1.21 | 1.26 |
| Largest Winning Trade | 582.40 | 564.40 | 582.40 |
| Largest Losing Trade | -533.60 | -531.60 | -533.60 |
| Max Consecutive Wins | 7 | 6 | 6 |
| Max Consecutive Losses | 6 | 4 | 6 |
| Avg. # of Trades per Day | 0.80 | 0.36 | 0.44 |
| Avg. Time in Market | 0h 43m | 0h 47m | 0h 40m |
| Profit per Month | 1,346.53 | 880.21 | 466.31 |
Click a trade below to view its trading day chart.
No OHLC price data is available for this day.
| # | Instrument | Side | Qty | Entry Price | Exit Price | Entry Time | Exit Time | Profit | Commission |
|---|---|---|---|---|---|---|---|---|---|
| 1 | MNQ 12-26 | Short | 3 | 25,841.00 | 25,899.50 | 2025-10-01 15:54 | 2025-10-01 16:15 | -354.90 | 3.90 |
| 2 | MNQ 12-26 | Short | 4 | 26,104.00 | 26,157.00 | 2025-10-02 16:53 | 2025-10-02 19:28 | -429.20 | 5.20 |
| 3 | MNQ 12-26 | Long | 2 | 25,930.25 | 25,964.25 | 2025-10-13 17:29 | 2025-10-13 22:55 | 133.40 | 2.60 |
| 4 | MNQ 12-26 | Long | 2 | 25,628.50 | 25,753.25 | 2025-10-14 16:01 | 2025-10-14 16:24 | 496.40 | 2.60 |
| 5 | MNQ 12-26 | Long | 4 | 25,883.75 | 25,938.25 | 2025-10-17 16:10 | 2025-10-17 16:11 | 430.80 | 5.20 |
| 6 | MNQ 12-26 | Short | 2 | 25,830.50 | 25,936.00 | 2025-10-17 17:01 | 2025-10-17 17:57 | -424.60 | 2.60 |
| 7 | MNQ 12-26 | Short | 3 | 26,188.00 | 26,109.00 | 2025-10-22 17:18 | 2025-10-22 17:23 | 470.10 | 3.90 |
| 8 | MNQ 12-26 | Long | 3 | 26,205.50 | 26,275.75 | 2025-10-23 16:32 | 2025-10-23 17:56 | 417.60 | 3.90 |
| 9 | MNQ 12-26 | Long | 4 | 26,576.75 | 26,576.50 | 2025-10-24 17:20 | 2025-10-24 22:55 | -7.20 | 5.20 |
| 10 | MNQ 12-26 | Long | 3 | 27,162.75 | 27,099.25 | 2025-10-30 15:05 | 2025-10-30 15:20 | -384.90 | 3.90 |
| 11 | MNQ 12-26 | Long | 2 | 26,760.75 | 26,853.50 | 2025-11-05 16:39 | 2025-11-05 18:27 | 368.40 | 2.60 |
| 12 | MNQ 12-26 | Long | 3 | 26,069.50 | 25,993.25 | 2025-11-07 16:00 | 2025-11-07 16:06 | -461.40 | 3.90 |
| 13 | MNQ 12-26 | Short | 4 | 26,646.25 | 26,593.25 | 2025-11-11 16:11 | 2025-11-11 16:30 | 418.80 | 5.20 |
| 14 | MNQ 12-26 | Short | 3 | 26,666.75 | 26,599.50 | 2025-11-12 16:22 | 2025-11-12 16:36 | 399.60 | 3.90 |
| 15 | MNQ 12-26 | Long | 3 | 26,431.00 | 26,500.75 | 2025-11-13 16:02 | 2025-11-13 16:09 | 414.60 | 3.90 |
| 16 | MNQ 12-26 | Long | 2 | 26,489.50 | 26,381.75 | 2025-11-13 16:12 | 2025-11-13 16:34 | -433.60 | 2.60 |
| 17 | MNQ 12-26 | Long | 2 | 26,289.25 | 26,201.25 | 2025-11-17 15:57 | 2025-11-17 16:03 | -354.60 | 2.60 |
| 18 | MNQ 12-26 | Short | 4 | 26,161.75 | 26,218.50 | 2025-11-17 16:11 | 2025-11-17 16:30 | -459.20 | 5.20 |
| 19 | MNQ 12-26 | Short | 1 | 25,593.75 | 25,732.75 | 2025-11-18 16:07 | 2025-11-18 17:32 | -279.30 | 1.30 |
| 20 | MNQ 12-26 | Short | 3 | 25,832.00 | 25,755.25 | 2025-11-19 17:00 | 2025-11-19 17:12 | 456.60 | 3.90 |
| 21 | MNQ 12-26 | Short | 3 | 25,783.00 | 25,704.75 | 2025-11-19 17:14 | 2025-11-19 18:04 | 465.60 | 3.90 |
| 22 | MNQ 12-26 | Short | 2 | 25,193.75 | 25,085.25 | 2025-11-21 16:20 | 2025-11-21 16:30 | 431.40 | 2.60 |
| 23 | MNQ 12-26 | Short | 2 | 25,092.00 | 25,001.75 | 2025-11-21 17:01 | 2025-11-21 17:05 | 358.40 | 2.60 |
| 24 | MNQ 12-26 | Short | 3 | 25,103.50 | 25,174.00 | 2025-11-21 17:10 | 2025-11-21 17:22 | -426.90 | 3.90 |
| 25 | MNQ 12-26 | Short | 5 | 25,782.00 | 25,819.25 | 2025-11-25 15:53 | 2025-11-25 15:55 | -379.00 | 6.50 |
| 26 | MNQ 12-26 | Short | 4 | 25,812.25 | 25,861.75 | 2025-11-25 16:17 | 2025-11-25 16:30 | -401.20 | 5.20 |
| 27 | MNQ 12-26 | Short | 4 | 26,275.75 | 26,220.25 | 2025-11-26 16:09 | 2025-11-26 16:22 | 438.80 | 5.20 |
| 28 | MNQ 12-26 | Long | 3 | 26,293.25 | 26,367.75 | 2025-11-26 16:42 | 2025-11-26 17:08 | 443.10 | 3.90 |
| 29 | MNQ 12-26 | Short | 3 | 26,822.00 | 26,735.25 | 2025-12-05 17:01 | 2025-12-05 17:31 | 516.60 | 3.90 |
| 30 | MNQ 12-26 | Long | 3 | 26,695.25 | 26,766.75 | 2025-12-10 17:21 | 2025-12-10 20:00 | 425.10 | 3.90 |
| 31 | MNQ 12-26 | Short | 2 | 26,537.75 | 26,537.25 | 2025-12-11 16:52 | 2025-12-11 17:20 | -0.60 | 2.60 |
| 32 | MNQ 12-26 | Short | 4 | 26,614.00 | 26,562.25 | 2025-12-12 15:53 | 2025-12-12 16:04 | 408.80 | 5.20 |
| 33 | MNQ 12-26 | Short | 4 | 26,210.25 | 26,261.75 | 2025-12-15 17:03 | 2025-12-15 17:16 | -417.20 | 5.20 |
| 34 | MNQ 12-26 | Long | 2 | 26,291.75 | 26,198.00 | 2025-12-15 17:21 | 2025-12-15 17:42 | -377.60 | 2.60 |
| 35 | MNQ 12-26 | Long | 2 | 26,336.25 | 26,402.50 | 2025-12-19 15:56 | 2025-12-19 22:55 | 262.40 | 2.60 |
| 36 | MNQ 12-26 | Long | 3 | 26,557.00 | 26,491.75 | 2025-12-22 16:00 | 2025-12-22 16:11 | -395.40 | 3.90 |
| 37 | MNQ 12-26 | Short | 3 | 26,505.50 | 26,505.00 | 2025-12-22 16:18 | 2025-12-22 22:55 | -0.90 | 3.90 |
| 38 | MNQ 12-26 | Short | 3 | 26,532.50 | 26,554.50 | 2025-12-29 16:00 | 2025-12-29 22:55 | -135.90 | 3.90 |
| 39 | MNQ 12-26 | Long | 2 | 26,553.50 | 26,459.00 | 2026-01-02 15:54 | 2026-01-02 16:12 | -380.60 | 2.60 |
| 40 | MNQ 12-26 | Short | 3 | 26,474.00 | 26,549.75 | 2026-01-06 17:06 | 2026-01-06 18:24 | -458.40 | 3.90 |
| 41 | MNQ 12-26 | Long | 2 | 26,496.50 | 26,407.50 | 2026-01-08 16:20 | 2026-01-08 17:35 | -358.60 | 2.60 |
| 42 | MNQ 12-26 | Short | 2 | 26,476.00 | 26,385.25 | 2026-01-14 15:50 | 2026-01-14 16:00 | 360.40 | 2.60 |
| 43 | MNQ 12-26 | Short | 2 | 26,400.75 | 26,280.75 | 2026-01-14 16:32 | 2026-01-14 16:51 | 477.40 | 2.60 |
| 44 | MNQ 12-26 | Long | 4 | 26,713.75 | 26,667.25 | 2026-01-15 16:42 | 2026-01-15 16:44 | -377.20 | 5.20 |
| 45 | MNQ 12-26 | Short | 2 | 26,571.25 | 26,442.50 | 2026-01-16 16:07 | 2026-01-16 16:36 | 512.40 | 2.60 |
| 46 | MNQ 12-26 | Short | 2 | 26,426.50 | 26,507.75 | 2026-01-22 15:53 | 2026-01-22 17:52 | -327.60 | 2.60 |
| 47 | MNQ 12-26 | Short | 3 | 26,761.50 | 26,694.00 | 2026-01-29 15:56 | 2026-01-29 15:58 | 401.10 | 3.90 |
| 48 | MNQ 12-26 | Short | 3 | 26,656.25 | 26,580.25 | 2026-01-30 17:03 | 2026-01-30 17:21 | 452.10 | 3.90 |
| 49 | MNQ 12-26 | Long | 2 | 26,569.25 | 26,660.50 | 2026-02-02 15:58 | 2026-02-02 16:12 | 362.40 | 2.60 |
| 50 | MNQ 12-26 | Short | 4 | 26,368.75 | 26,312.75 | 2026-02-03 16:28 | 2026-02-03 16:34 | 442.80 | 5.20 |
| 51 | MNQ 12-26 | Short | 2 | 26,360.75 | 26,266.25 | 2026-02-03 17:12 | 2026-02-03 18:12 | 375.40 | 2.60 |
| 52 | MNQ 12-26 | Short | 2 | 26,024.75 | 26,024.25 | 2026-02-04 16:09 | 2026-02-04 16:30 | -0.60 | 2.60 |
| 53 | MNQ 12-26 | Short | 2 | 25,409.75 | 25,515.75 | 2026-02-05 16:51 | 2026-02-05 17:20 | -426.60 | 2.60 |
| 54 | MNQ 12-26 | Short | 3 | 25,624.25 | 25,685.25 | 2026-02-06 16:18 | 2026-02-06 16:21 | -369.90 | 3.90 |
| 55 | MNQ 12-26 | Long | 3 | 25,722.75 | 25,664.50 | 2026-02-06 16:40 | 2026-02-06 16:52 | -353.40 | 3.90 |
| 56 | MNQ 12-26 | Long | 2 | 25,539.25 | 25,634.00 | 2026-02-13 15:55 | 2026-02-13 16:11 | 376.40 | 2.60 |
| 57 | MNQ 12-26 | Long | 3 | 25,563.00 | 25,649.25 | 2026-02-13 16:20 | 2026-02-13 16:27 | 513.60 | 3.90 |
| 58 | MNQ 12-26 | Short | 2 | 25,363.75 | 25,475.50 | 2026-02-17 16:06 | 2026-02-17 17:03 | -449.60 | 2.60 |
| 59 | MNQ 12-26 | Long | 3 | 25,677.50 | 25,764.00 | 2026-02-19 16:01 | 2026-02-19 17:20 | 515.10 | 3.90 |
| 60 | MNQ 12-26 | Long | 2 | 25,753.75 | 25,754.25 | 2026-02-20 16:14 | 2026-02-20 16:17 | -0.60 | 2.60 |
| 61 | MNQ 12-26 | Long | 2 | 25,776.25 | 25,901.00 | 2026-02-20 16:20 | 2026-02-20 16:48 | 496.40 | 2.60 |
| 62 | MNQ 12-26 | Short | 3 | 25,752.50 | 25,666.75 | 2026-02-23 15:51 | 2026-02-23 16:05 | 510.60 | 3.90 |
| 63 | MNQ 12-26 | Long | 4 | 25,691.00 | 25,637.25 | 2026-02-24 15:56 | 2026-02-24 16:00 | -435.20 | 5.20 |
| 64 | MNQ 12-26 | Long | 2 | 25,737.25 | 25,828.00 | 2026-02-27 16:19 | 2026-02-27 17:04 | 360.40 | 2.60 |
| 65 | MNQ 12-26 | Long | 2 | 25,664.50 | 25,806.25 | 2026-03-02 15:52 | 2026-03-02 17:41 | 564.40 | 2.60 |
| 66 | MNQ 12-26 | Long | 2 | 25,372.75 | 25,462.25 | 2026-03-03 17:11 | 2026-03-03 17:44 | 355.40 | 2.60 |
| 67 | MNQ 12-26 | Long | 3 | 25,920.00 | 26,006.25 | 2026-03-04 17:10 | 2026-03-04 19:32 | 513.60 | 3.90 |
| 68 | MNQ 12-26 | Short | 3 | 25,838.00 | 25,752.50 | 2026-03-05 16:39 | 2026-03-05 17:19 | 509.10 | 3.90 |
| 69 | MNQ 12-26 | Short | 3 | 25,797.25 | 25,727.50 | 2026-03-10 15:06 | 2026-03-10 15:08 | 414.60 | 3.90 |
| 70 | MNQ 12-26 | Long | 3 | 25,813.50 | 25,897.50 | 2026-03-10 15:30 | 2026-03-10 15:39 | 500.10 | 3.90 |
| 71 | MNQ 12-26 | Short | 7 | 25,830.50 | 25,859.75 | 2026-03-11 15:39 | 2026-03-11 15:44 | -418.60 | 9.10 |
| 72 | MNQ 12-26 | Short | 3 | 25,552.75 | 25,464.75 | 2026-03-12 14:51 | 2026-03-12 14:55 | 524.10 | 3.90 |
| 73 | MNQ 12-26 | Long | 2 | 25,547.75 | 25,440.50 | 2026-03-13 14:51 | 2026-03-13 15:40 | -431.60 | 2.60 |
| 74 | MNQ 12-26 | Short | 3 | 25,471.50 | 25,404.50 | 2026-03-18 16:23 | 2026-03-18 18:09 | 398.10 | 3.90 |
| 75 | MNQ 12-26 | Short | 2 | 25,021.75 | 25,116.75 | 2026-03-19 15:30 | 2026-03-19 15:35 | -382.60 | 2.60 |
| 76 | MNQ 12-26 | Long | 2 | 25,079.75 | 25,170.00 | 2026-03-19 15:42 | 2026-03-19 16:06 | 358.40 | 2.60 |
| 77 | MNQ 12-26 | Long | 3 | 25,244.25 | 25,179.00 | 2026-03-23 16:18 | 2026-03-23 16:35 | -395.40 | 3.90 |
| 78 | MNQ 12-26 | Long | 3 | 24,839.50 | 24,911.00 | 2026-03-24 16:00 | 2026-03-24 16:11 | 425.10 | 3.90 |
| 79 | MNQ 12-26 | Long | 2 | 25,042.50 | 24,962.00 | 2026-03-25 15:20 | 2026-03-25 16:16 | -324.60 | 2.60 |
| 80 | MNQ 12-26 | Long | 3 | 24,753.50 | 24,831.75 | 2026-03-26 14:59 | 2026-03-26 15:07 | 465.60 | 3.90 |
| 81 | MNQ 12-26 | Short | 3 | 24,092.25 | 24,159.25 | 2026-03-27 15:35 | 2026-03-27 16:23 | -405.90 | 3.90 |
| 82 | MNQ 12-26 | Short | 2 | 23,968.75 | 23,832.00 | 2026-03-30 15:53 | 2026-03-30 19:15 | 544.40 | 2.60 |
| 83 | MNQ 12-26 | Long | 3 | 24,143.00 | 24,085.75 | 2026-03-31 16:26 | 2026-03-31 16:43 | -347.40 | 3.90 |
| 84 | MNQ 12-26 | Long | 2 | 24,129.50 | 24,255.75 | 2026-03-31 17:20 | 2026-03-31 18:39 | 502.40 | 2.60 |
| 85 | MNQ 12-26 | Short | 3 | 24,706.00 | 24,766.25 | 2026-04-01 15:52 | 2026-04-01 16:08 | -365.40 | 3.90 |
| 86 | MNQ 12-26 | Long | 2 | 24,962.25 | 24,876.50 | 2026-04-06 16:21 | 2026-04-06 16:48 | -345.60 | 2.60 |
| 87 | MNQ 12-26 | Short | 2 | 24,645.50 | 24,645.00 | 2026-04-07 16:17 | 2026-04-07 16:52 | -0.60 | 2.60 |
| 88 | MNQ 12-26 | Short | 2 | 24,644.75 | 24,555.75 | 2026-04-07 16:57 | 2026-04-07 17:05 | 353.40 | 2.60 |
| 89 | MNQ 12-26 | Short | 12 | 25,690.25 | 25,671.25 | 2026-04-08 16:06 | 2026-04-08 16:06 | 440.40 | 15.60 |
| 90 | MNQ 12-26 | Short | 4 | 25,630.00 | 25,567.00 | 2026-04-09 16:05 | 2026-04-09 16:26 | 498.80 | 5.20 |
| 91 | MNQ 12-26 | Long | 3 | 25,839.50 | 25,918.00 | 2026-04-13 15:53 | 2026-04-13 16:00 | 467.10 | 3.90 |
| 92 | MNQ 12-26 | Short | 2 | 26,919.00 | 27,003.75 | 2026-04-16 16:03 | 2026-04-16 16:45 | -341.60 | 2.60 |
| 93 | MNQ 12-26 | Long | 5 | 27,371.25 | 27,331.25 | 2026-04-20 16:02 | 2026-04-20 16:08 | -406.50 | 6.50 |
| 94 | MNQ 12-26 | Short | 3 | 27,386.75 | 27,307.75 | 2026-04-21 16:53 | 2026-04-21 17:00 | 470.10 | 3.90 |
| 95 | MNQ 12-26 | Short | 3 | 27,341.25 | 27,266.50 | 2026-04-21 17:10 | 2026-04-21 18:44 | 444.60 | 3.90 |
| 96 | MNQ 12-26 | Short | 3 | 27,609.75 | 27,674.25 | 2026-04-23 16:04 | 2026-04-23 16:55 | -390.90 | 3.90 |
| 97 | MNQ 12-26 | Short | 4 | 27,784.00 | 27,836.50 | 2026-04-24 16:06 | 2026-04-24 16:09 | -425.20 | 5.20 |
| 98 | MNQ 12-26 | Short | 4 | 27,794.25 | 27,843.50 | 2026-04-24 16:36 | 2026-04-24 16:43 | -399.20 | 5.20 |
| 99 | MNQ 12-26 | Short | 2 | 27,920.00 | 27,817.50 | 2026-04-30 15:50 | 2026-04-30 15:57 | 407.40 | 2.60 |
| 100 | MNQ 12-26 | Short | 2 | 27,874.75 | 27,774.50 | 2026-04-30 16:02 | 2026-04-30 16:16 | 398.40 | 2.60 |
| 101 | MNQ 12-26 | Short | 2 | 28,393.25 | 28,489.75 | 2026-05-01 16:41 | 2026-05-01 17:37 | -388.60 | 2.60 |
| 102 | MNQ 12-26 | Long | 3 | 28,693.75 | 28,772.00 | 2026-05-05 16:39 | 2026-05-05 20:04 | 465.60 | 3.90 |
| 103 | MNQ 12-26 | Long | 3 | 29,072.25 | 28,996.50 | 2026-05-06 15:59 | 2026-05-06 16:06 | -458.40 | 3.90 |
| 104 | MNQ 12-26 | Short | 3 | 29,017.75 | 29,086.00 | 2026-05-06 16:21 | 2026-05-06 16:35 | -413.40 | 3.90 |
| 105 | MNQ 12-26 | Long | 2 | 29,650.50 | 29,782.00 | 2026-05-08 15:58 | 2026-05-08 17:06 | 523.40 | 2.60 |
| 106 | MNQ 12-26 | Short | 3 | 29,940.50 | 30,007.75 | 2026-05-11 16:38 | 2026-05-11 17:25 | -407.40 | 3.90 |
| 107 | MNQ 12-26 | Short | 2 | 29,732.75 | 29,605.75 | 2026-05-12 16:10 | 2026-05-12 16:33 | 505.40 | 2.60 |
| 108 | MNQ 12-26 | Short | 3 | 29,694.00 | 29,619.00 | 2026-05-12 16:40 | 2026-05-12 16:51 | 446.10 | 3.90 |
| 109 | MNQ 12-26 | Long | 2 | 29,827.25 | 29,926.25 | 2026-05-13 16:33 | 2026-05-13 17:00 | 393.40 | 2.60 |
| 110 | MNQ 12-26 | Long | 3 | 30,244.75 | 30,182.50 | 2026-05-14 15:53 | 2026-05-14 15:55 | -377.40 | 3.90 |
| 111 | MNQ 12-26 | Long | 2 | 30,237.50 | 30,358.50 | 2026-05-14 16:22 | 2026-05-14 17:20 | 481.40 | 2.60 |
| 112 | MNQ 12-26 | Short | 3 | 29,562.25 | 29,619.50 | 2026-05-19 15:51 | 2026-05-19 15:55 | -347.40 | 3.90 |
| 113 | MNQ 12-26 | Short | 3 | 29,549.75 | 29,475.25 | 2026-05-19 15:58 | 2026-05-19 16:02 | 443.10 | 3.90 |
| 114 | MNQ 12-26 | Long | 3 | 29,716.25 | 29,655.50 | 2026-05-20 15:54 | 2026-05-20 15:55 | -368.40 | 3.90 |
| 115 | MNQ 12-26 | Long | 4 | 29,881.25 | 29,834.00 | 2026-05-21 16:08 | 2026-05-21 16:15 | -383.20 | 5.20 |
| 116 | MNQ 12-26 | Long | 2 | 30,226.50 | 30,327.25 | 2026-05-22 16:50 | 2026-05-22 19:29 | 400.40 | 2.60 |
| 117 | MNQ 12-26 | Long | 2 | 30,525.50 | 30,614.25 | 2026-05-26 15:54 | 2026-05-26 16:00 | 352.40 | 2.60 |
| 118 | MNQ 12-26 | Short | 2 | 30,597.75 | 30,485.50 | 2026-05-27 16:12 | 2026-05-27 16:28 | 446.40 | 2.60 |
| 119 | MNQ 12-26 | Short | 2 | 30,562.75 | 30,657.75 | 2026-05-27 16:37 | 2026-05-27 21:06 | -382.60 | 2.60 |
| 120 | MNQ 12-26 | Short | 3 | 30,966.25 | 31,044.50 | 2026-06-01 16:09 | 2026-06-01 17:00 | -473.40 | 3.90 |
| 121 | MNQ 12-26 | Long | 4 | 31,217.25 | 31,273.50 | 2026-06-02 16:46 | 2026-06-02 17:35 | 444.80 | 5.20 |
| 122 | MNQ 12-26 | Short | 2 | 31,212.75 | 31,212.25 | 2026-06-03 15:53 | 2026-06-03 17:25 | -0.60 | 2.60 |
| 123 | MNQ 12-26 | Short | 3 | 30,852.25 | 30,771.00 | 2026-06-04 15:57 | 2026-06-04 16:05 | 483.60 | 3.90 |
| 124 | MNQ 12-26 | Long | 3 | 30,907.50 | 30,980.00 | 2026-06-04 16:40 | 2026-06-04 17:05 | 431.10 | 3.90 |
| 125 | MNQ 12-26 | Long | 4 | 30,530.75 | 30,482.00 | 2026-06-05 16:21 | 2026-06-05 16:22 | -395.20 | 5.20 |
| 126 | MNQ 12-26 | Short | 2 | 30,445.50 | 30,338.75 | 2026-06-05 16:30 | 2026-06-05 17:13 | 424.40 | 2.60 |
| 127 | MNQ 12-26 | Short | 2 | 30,026.25 | 30,127.25 | 2026-06-08 16:09 | 2026-06-08 16:30 | -406.60 | 2.60 |
| 128 | MNQ 12-26 | Long | 2 | 30,368.50 | 30,255.50 | 2026-06-09 15:54 | 2026-06-09 16:00 | -454.60 | 2.60 |
| 129 | MNQ 12-26 | Short | 1 | 30,104.00 | 29,939.75 | 2026-06-09 16:26 | 2026-06-09 16:43 | 327.20 | 1.30 |
| 130 | MNQ 12-26 | Long | 5 | 29,608.75 | 29,649.00 | 2026-06-10 15:52 | 2026-06-10 15:56 | 396.00 | 6.50 |
| 131 | MNQ 12-26 | Long | 3 | 29,641.25 | 29,574.25 | 2026-06-10 15:59 | 2026-06-10 16:01 | -405.90 | 3.90 |
| 132 | MNQ 12-26 | Long | 2 | 29,677.50 | 29,807.50 | 2026-06-10 16:19 | 2026-06-10 16:24 | 517.40 | 2.60 |
| 133 | MNQ 12-26 | Short | 6 | 29,400.75 | 29,432.75 | 2026-06-11 16:21 | 2026-06-11 16:22 | -391.80 | 7.80 |
| 134 | MNQ 12-26 | Long | 4 | 29,436.25 | 29,496.25 | 2026-06-11 16:38 | 2026-06-11 16:38 | 474.80 | 5.20 |
| 135 | MNQ 12-26 | Long | 2 | 29,466.00 | 29,381.75 | 2026-06-11 16:40 | 2026-06-11 16:46 | -339.60 | 2.60 |
| 136 | MNQ 12-26 | Short | 2 | 29,941.25 | 30,029.00 | 2026-06-12 15:53 | 2026-06-12 16:01 | -353.60 | 2.60 |
| 137 | MNQ 12-26 | Short | 3 | 29,966.75 | 30,041.50 | 2026-06-12 16:50 | 2026-06-12 16:52 | -452.40 | 3.90 |
| 138 | MNQ 12-26 | Long | 3 | 31,027.25 | 31,108.50 | 2026-06-15 15:59 | 2026-06-15 17:03 | 483.60 | 3.90 |
| 139 | MNQ 12-26 | Long | 5 | 30,763.50 | 30,721.00 | 2026-06-17 15:53 | 2026-06-17 15:56 | -431.50 | 6.50 |
| 140 | MNQ 12-26 | Long | 2 | 30,779.75 | 30,671.25 | 2026-06-17 16:22 | 2026-06-17 16:47 | -436.60 | 2.60 |
| 141 | MNQ 12-26 | Long | 2 | 30,822.25 | 30,933.00 | 2026-06-18 16:15 | 2026-06-18 16:24 | 440.40 | 2.60 |
| 142 | MNQ 12-26 | Short | 4 | 31,151.50 | 31,202.25 | 2026-06-22 15:56 | 2026-06-22 15:57 | -411.20 | 5.20 |
| 143 | MNQ 12-26 | Short | 5 | 30,151.00 | 30,105.25 | 2026-06-23 16:54 | 2026-06-23 17:05 | 451.00 | 6.50 |
| 144 | MNQ 12-26 | Short | 2 | 30,099.25 | 29,998.25 | 2026-06-23 17:08 | 2026-06-23 17:38 | 401.40 | 2.60 |
| 145 | MNQ 12-26 | Short | 1 | 29,873.75 | 30,040.00 | 2026-06-25 16:08 | 2026-06-25 16:52 | -333.80 | 1.30 |
| 146 | MNQ 12-26 | Short | 5 | 29,933.75 | 29,972.75 | 2026-06-25 17:00 | 2026-06-25 17:01 | -396.50 | 6.50 |
| 147 | MNQ 12-26 | Long | 2 | 29,854.25 | 29,987.25 | 2026-06-26 17:28 | 2026-06-26 17:42 | 529.40 | 2.60 |
| 148 | MNQ 12-26 | Long | 2 | 30,012.50 | 30,147.00 | 2026-06-29 17:01 | 2026-06-29 17:59 | 535.40 | 2.60 |
| 149 | MNQ 12-26 | Long | 3 | 30,513.00 | 30,585.25 | 2026-06-30 15:50 | 2026-06-30 15:51 | 429.60 | 3.90 |
| 150 | MNQ 12-26 | Long | 3 | 30,633.75 | 30,705.00 | 2026-06-30 16:10 | 2026-06-30 16:23 | 423.60 | 3.90 |
| 151 | MNQ 12-26 | Long | 3 | 30,567.00 | 30,644.75 | 2026-07-01 17:17 | 2026-07-01 17:29 | 462.60 | 3.90 |
| 152 | MNQ 12-26 | Short | 2 | 29,582.00 | 29,662.50 | 2026-07-07 17:21 | 2026-07-07 17:45 | -324.60 | 2.60 |
| 153 | MNQ 12-26 | Long | 2 | 30,202.00 | 30,103.25 | 2026-07-09 16:03 | 2026-07-09 16:11 | -397.60 | 2.60 |
| 154 | MNQ 12-26 | Short | 2 | 30,010.75 | 30,120.50 | 2026-07-09 16:26 | 2026-07-09 16:58 | -441.60 | 2.60 |
| 155 | MNQ 12-26 | Long | 2 | 30,221.25 | 30,221.75 | 2026-07-10 15:57 | 2026-07-10 16:27 | -0.60 | 2.60 |
| 156 | MNQ 12-26 | Short | 2 | 30,157.75 | 30,253.00 | 2026-07-10 16:43 | 2026-07-10 17:16 | -383.60 | 2.60 |
| 157 | MNQ 12-26 | Long | 2 | 29,965.00 | 29,845.25 | 2026-07-13 16:38 | 2026-07-13 18:26 | -481.60 | 2.60 |
| 158 | MNQ 12-26 | Long | 2 | 30,061.75 | 30,179.00 | 2026-07-14 17:04 | 2026-07-14 17:24 | 466.40 | 2.60 |
| 159 | MNQ 12-26 | Short | 2 | 30,104.75 | 29,958.50 | 2026-07-15 15:58 | 2026-07-15 16:24 | 582.40 | 2.60 |
| 160 | MNQ 12-26 | Short | 3 | 29,894.75 | 29,815.75 | 2026-07-15 17:27 | 2026-07-15 18:05 | 470.10 | 3.90 |
| 161 | MNQ 12-26 | Short | 4 | 29,638.50 | 29,588.25 | 2026-07-16 15:53 | 2026-07-16 15:55 | 396.80 | 5.20 |
| 162 | MNQ 12-26 | Short | 2 | 29,637.75 | 29,770.50 | 2026-07-16 15:57 | 2026-07-16 16:08 | -533.60 | 2.60 |
| 163 | MNQ 12-26 | Long | 2 | 29,753.75 | 29,671.75 | 2026-07-16 16:19 | 2026-07-16 16:55 | -330.60 | 2.60 |
| 164 | MNQ 12-26 | Short | 3 | 29,334.50 | 29,267.75 | 2026-07-20 16:04 | 2026-07-20 16:10 | 396.60 | 3.90 |
| 165 | MNQ 12-26 | Short | 3 | 29,279.25 | 29,196.00 | 2026-07-20 16:43 | 2026-07-20 16:53 | 495.60 | 3.90 |
| 166 | MNQ 12-26 | Long | 2 | 29,533.25 | 29,628.50 | 2026-07-22 16:09 | 2026-07-22 17:24 | 378.40 | 2.60 |
| 167 | MNQ 12-26 | Short | 2 | 28,668.50 | 28,668.00 | 2026-07-24 16:03 | 2026-07-24 17:09 | -0.60 | 2.60 |
| 168 | MNQ 12-26 | Long | 2 | 28,797.50 | 28,897.00 | 2026-07-24 17:23 | 2026-07-24 18:05 | 395.40 | 2.60 |
| 169 | MNQ 12-26 | Short | 2 | 28,795.50 | 28,694.00 | 2026-07-27 15:52 | 2026-07-27 15:57 | 403.40 | 2.60 |
| 170 | MNQ 12-26 | Short | 2 | 28,405.25 | 28,297.00 | 2026-07-27 17:19 | 2026-07-27 17:37 | 430.40 | 2.60 |
| 171 | MNQ 12-26 | Short | 2 | 28,026.00 | 27,937.50 | 2026-07-28 15:52 | 2026-07-28 16:14 | 351.40 | 2.60 |
| 172 | MNQ 12-26 | Long | 2 | 28,119.50 | 28,217.50 | 2026-07-28 16:58 | 2026-07-28 17:18 | 389.40 | 2.60 |
| 173 | MNQ 12-26 | Short | 3 | 28,074.25 | 27,992.25 | 2026-07-29 16:03 | 2026-07-29 16:12 | 488.10 | 3.90 |
| 174 | MNQ 12-26 | Short | 2 | 27,874.50 | 27,779.25 | 2026-07-29 17:22 | 2026-07-29 17:55 | 378.40 | 2.60 |
| 175 | MNQ 12-26 | Short | 2 | 28,354.75 | 28,442.75 | 2026-07-30 17:21 | 2026-07-30 18:04 | -354.60 | 2.60 |
| 176 | MNQ 12-26 | Short | 2 | 28,696.25 | 28,564.00 | 2026-07-31 15:57 | 2026-07-31 16:03 | 526.40 | 2.60 |
| 177 | MNQ 12-26 | Short | 2 | 28,557.75 | 28,459.25 | 2026-07-31 17:19 | 2026-07-31 17:26 | 391.40 | 2.60 |
| 178 | MNQ 12-26 | Long | 3 | 28,775.00 | 28,845.75 | 2026-08-03 15:50 | 2026-08-03 15:55 | 420.60 | 3.90 |
| 179 | MNQ 12-26 | Long | 3 | 28,854.50 | 28,931.75 | 2026-08-03 16:05 | 2026-08-03 16:18 | 459.60 | 3.90 |
| 180 | MNQ 12-26 | Short | 5 | 30,298.50 | 30,257.50 | 2026-08-05 16:18 | 2026-08-05 16:20 | 403.50 | 6.50 |
| 181 | MNQ 12-26 | Long | 2 | 29,800.25 | 29,904.00 | 2026-08-06 15:54 | 2026-08-06 16:11 | 412.40 | 2.60 |
| 182 | MNQ 12-26 | Long | 2 | 29,912.00 | 29,912.50 | 2026-08-06 16:56 | 2026-08-06 17:49 | -0.60 | 2.60 |
| 183 | MNQ 12-26 | Long | 2 | 30,060.50 | 30,120.75 | 2026-08-07 16:30 | 2026-08-07 22:55 | 238.40 | 2.60 |
| 184 | MNQ 12-26 | Short | 3 | 30,102.25 | 30,068.75 | 2026-08-10 17:01 | 2026-08-10 22:55 | 197.10 | 3.90 |
| 185 | MNQ 12-26 | Short | 2 | 30,008.75 | 29,917.25 | 2026-08-11 17:20 | 2026-08-11 18:47 | 363.40 | 2.60 |
| 186 | MNQ 12-26 | Short | 4 | 30,203.00 | 30,151.00 | 2026-08-12 16:02 | 2026-08-12 16:05 | 410.80 | 5.20 |
| 187 | MNQ 12-26 | Short | 5 | 30,204.00 | 30,203.50 | 2026-08-12 16:07 | 2026-08-12 16:29 | -1.50 | 6.50 |
| 188 | MNQ 12-26 | Long | 4 | 30,532.00 | 30,484.75 | 2026-08-17 15:57 | 2026-08-17 16:06 | -383.20 | 5.20 |
| 189 | MNQ 12-26 | Short | 2 | 29,802.75 | 29,711.50 | 2026-08-19 15:57 | 2026-08-19 16:11 | 362.40 | 2.60 |
| 190 | MNQ 12-26 | Long | 3 | 29,863.50 | 29,927.25 | 2026-08-19 16:41 | 2026-08-19 17:01 | 378.60 | 3.90 |
| 191 | MNQ 12-26 | Long | 3 | 29,711.50 | 29,631.50 | 2026-08-20 16:41 | 2026-08-20 17:11 | -483.90 | 3.90 |
| 192 | MNQ 12-26 | Short | 2 | 29,603.50 | 29,700.50 | 2026-08-21 16:00 | 2026-08-21 17:34 | -390.60 | 2.60 |
| 193 | MNQ 12-26 | Short | 3 | 29,310.00 | 29,377.75 | 2026-08-24 15:55 | 2026-08-24 16:34 | -410.40 | 3.90 |
| 194 | MNQ 12-26 | Long | 2 | 29,381.50 | 29,499.50 | 2026-08-24 16:40 | 2026-08-24 17:47 | 469.40 | 2.60 |
| 195 | MNQ 12-26 | Long | 4 | 29,660.75 | 29,615.25 | 2026-08-25 15:54 | 2026-08-25 15:55 | -369.20 | 5.20 |
| 196 | MNQ 12-26 | Long | 2 | 29,855.00 | 29,764.75 | 2026-08-27 15:54 | 2026-08-27 15:56 | -363.60 | 2.60 |
| 197 | MNQ 12-26 | Long | 4 | 29,417.25 | 29,475.25 | 2026-09-01 15:56 | 2026-09-01 16:22 | 458.80 | 5.20 |
| 198 | MNQ 12-26 | Short | 3 | 29,587.25 | 29,650.00 | 2026-09-03 16:12 | 2026-09-03 16:20 | -380.40 | 3.90 |
| 199 | MNQ 12-26 | Short | 3 | 29,596.75 | 29,655.50 | 2026-09-03 16:42 | 2026-09-03 16:59 | -356.40 | 3.90 |
| 200 | MNQ 12-26 | Long | 3 | 29,856.25 | 29,942.75 | 2026-09-08 16:57 | 2026-09-08 17:42 | 515.10 | 3.90 |
| 201 | MNQ 12-26 | Short | 3 | 29,398.00 | 29,476.75 | 2026-09-10 16:00 | 2026-09-10 16:03 | -476.40 | 3.90 |
| 202 | MNQ 12-26 | Short | 5 | 29,438.25 | 29,477.25 | 2026-09-10 16:07 | 2026-09-10 16:20 | -396.50 | 6.50 |
| 203 | MNQ 12-26 | Short | 6 | 29,711.00 | 29,674.75 | 2026-09-11 16:11 | 2026-09-11 16:17 | 427.20 | 7.80 |
| 204 | MNQ 12-26 | Short | 4 | 29,694.75 | 29,637.25 | 2026-09-11 16:41 | 2026-09-11 16:48 | 454.80 | 5.20 |
| 205 | MNQ 12-26 | Long | 2 | 29,291.75 | 29,432.00 | 2026-09-14 15:56 | 2026-09-14 17:33 | 558.40 | 2.60 |
| 206 | MNQ 12-26 | Long | 2 | 30,410.25 | 30,506.25 | 2026-09-21 16:05 | 2026-09-21 16:26 | 381.40 | 2.60 |
| 207 | MNQ 12-26 | Long | 2 | 30,803.50 | 30,707.50 | 2026-09-23 17:10 | 2026-09-23 18:43 | -386.60 | 2.60 |
| 208 | MNQ 12-26 | Short | 3 | 30,751.75 | 30,828.75 | 2026-09-25 16:25 | 2026-09-25 16:59 | -465.90 | 3.90 |
| 209 | MNQ 12-26 | Short | 2 | 30,570.75 | 30,456.75 | 2026-09-28 16:19 | 2026-09-28 16:43 | 453.40 | 2.60 |
| 210 | MNQ 12-26 | Short | 2 | 30,577.75 | 30,664.75 | 2026-09-29 15:50 | 2026-09-29 16:19 | -350.60 | 2.60 |
| 211 | MNQ 12-26 | Short | 3 | 30,637.75 | 30,711.75 | 2026-10-01 16:27 | 2026-10-01 16:39 | -447.90 | 3.90 |
| 212 | MNQ 12-26 | Short | 2 | 30,625.75 | 30,718.00 | 2026-10-01 16:54 | 2026-10-01 19:20 | -371.60 | 2.60 |
| 213 | MNQ 12-26 | Short | 3 | 31,179.25 | 31,091.25 | 2026-10-02 17:02 | 2026-10-02 17:09 | 524.10 | 3.90 |
| 214 | MNQ 12-26 | Long | 3 | 31,238.50 | 31,321.50 | 2026-10-07 16:00 | 2026-10-07 17:36 | 494.10 | 3.90 |
| 215 | MNQ 12-26 | Short | 19 | 31,039.25 | 31,027.50 | 2026-10-09 15:59 | 2026-10-09 15:59 | 421.80 | 24.70 |
| 216 | MNQ 12-26 | Short | 5 | 30,975.50 | 30,926.75 | 2026-10-12 15:51 | 2026-10-12 16:06 | 481.00 | 6.50 |
| 217 | MNQ 12-26 | Short | 2 | 30,526.75 | 30,423.00 | 2026-10-14 16:04 | 2026-10-14 16:52 | 412.40 | 2.60 |
| 218 | MNQ 12-26 | Long | 2 | 29,791.00 | 29,913.25 | 2026-10-15 16:15 | 2026-10-15 16:42 | 486.40 | 2.60 |
| 219 | MNQ 12-26 | Long | 2 | 29,906.25 | 29,806.00 | 2026-10-16 16:41 | 2026-10-16 17:02 | -403.60 | 2.60 |
| 220 | MNQ 12-26 | Long | 2 | 29,164.00 | 29,264.75 | 2026-10-23 16:34 | 2026-10-23 16:44 | 400.40 | 2.60 |
| 1 | MNQ 12-26 | Short | 6 | 29,265.00 | 29,264.50 | 2026-10-26 14:51 | 2026-10-26 14:51 | -1.80 | 7.80 |
| 2 | MNQ 12-26 | Short | 2 | 29,571.25 | 29,659.75 | 2026-10-27 14:59 | 2026-10-27 15:33 | -356.60 | 2.60 |
| 3 | MNQ 12-26 | Short | 2 | 29,815.25 | 29,940.75 | 2026-10-28 14:53 | 2026-10-28 19:35 | -504.60 | 2.60 |
| 4 | MNQ 12-26 | Short | 2 | 29,499.50 | 29,607.50 | 2026-10-29 15:52 | 2026-10-29 16:09 | -434.60 | 2.60 |
| 5 | MNQ 12-26 | Long | 4 | 29,595.50 | 29,657.75 | 2026-10-29 16:20 | 2026-10-29 16:33 | 492.80 | 5.20 |
| 6 | MNQ 12-26 | Long | 2 | 28,803.75 | 28,671.50 | 2026-10-30 15:50 | 2026-10-30 16:33 | -531.60 | 2.60 |
| Rule | Enabled | Value |
|---|---|---|
| Daily Loss Limit |
|
$
|
| Maximum Drawdown |
|
$
|
| Payout Trigger Threshold |
|
$
|
| Consistency Rule |
|
%
|
| Minimum Trade Days |
|
|
| Minimum Daily Profit |
|
$
|
| Safety Net |
|
$
|
| PropFirm Account Cost |
$
|
Backtest Start Date
Click and drag anywhere on the chart to choose which day the simulated account starts on.
| Date | Cycle | Event | Reason | Balance | Payout Amount |
|---|
| Cycle | Start Date | End Date | Duration (days) | Payouts | Total Payout $ | End Reason |
|---|
Download & Installation Instructions
License Requirements
At automated-trading.ch you can choose to either purchase a monthly subscription to use our premium products, or use our free products without subscribing.
In both cases, you need to create an account so you can get a License you can use for both premium and free products.
To obtain your license, simply sign up and then get your license on the billing page.
Download
You can also download this strategy — and every other automated-trading.ch strategy or indicator — anytime from your centralized Downloads page.
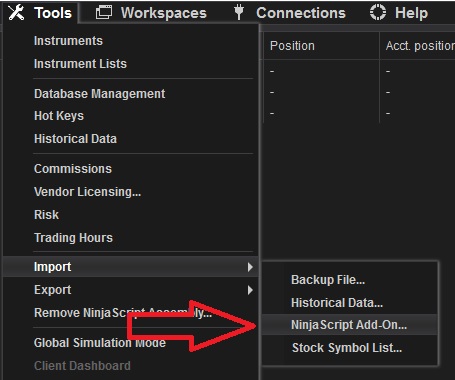
Installation Steps
Frequently Asked Questions
General
VWAP & Strategy Logic
Billing
Technical
Release Notes
- First Release